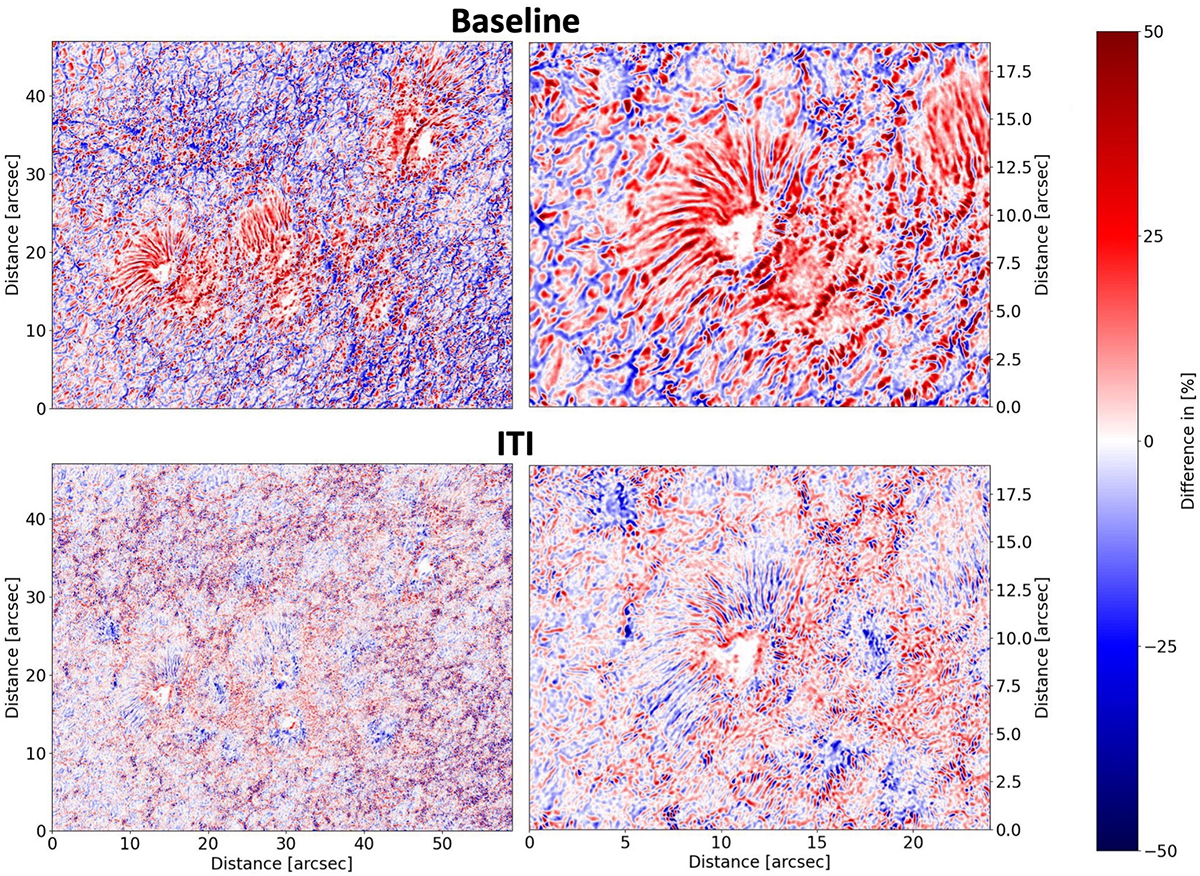
Fig. 6.
Download original image
Example to illustrate the performance of an image reconstruction with ITI (lower panels) and the corresponding baseline (difference between single frame of original burst and speckle reconstruction; upper panels). Each panel shows the pixel-wise difference of the reconstructed image with a single frame of the image burst and is called to ±50%. The right panels show a zoom-in of one of the sunspots shown in the left panels.
Current usage metrics show cumulative count of Article Views (full-text article views including HTML views, PDF and ePub downloads, according to the available data) and Abstracts Views on Vision4Press platform.
Data correspond to usage on the plateform after 2015. The current usage metrics is available 48-96 hours after online publication and is updated daily on week days.
Initial download of the metrics may take a while.