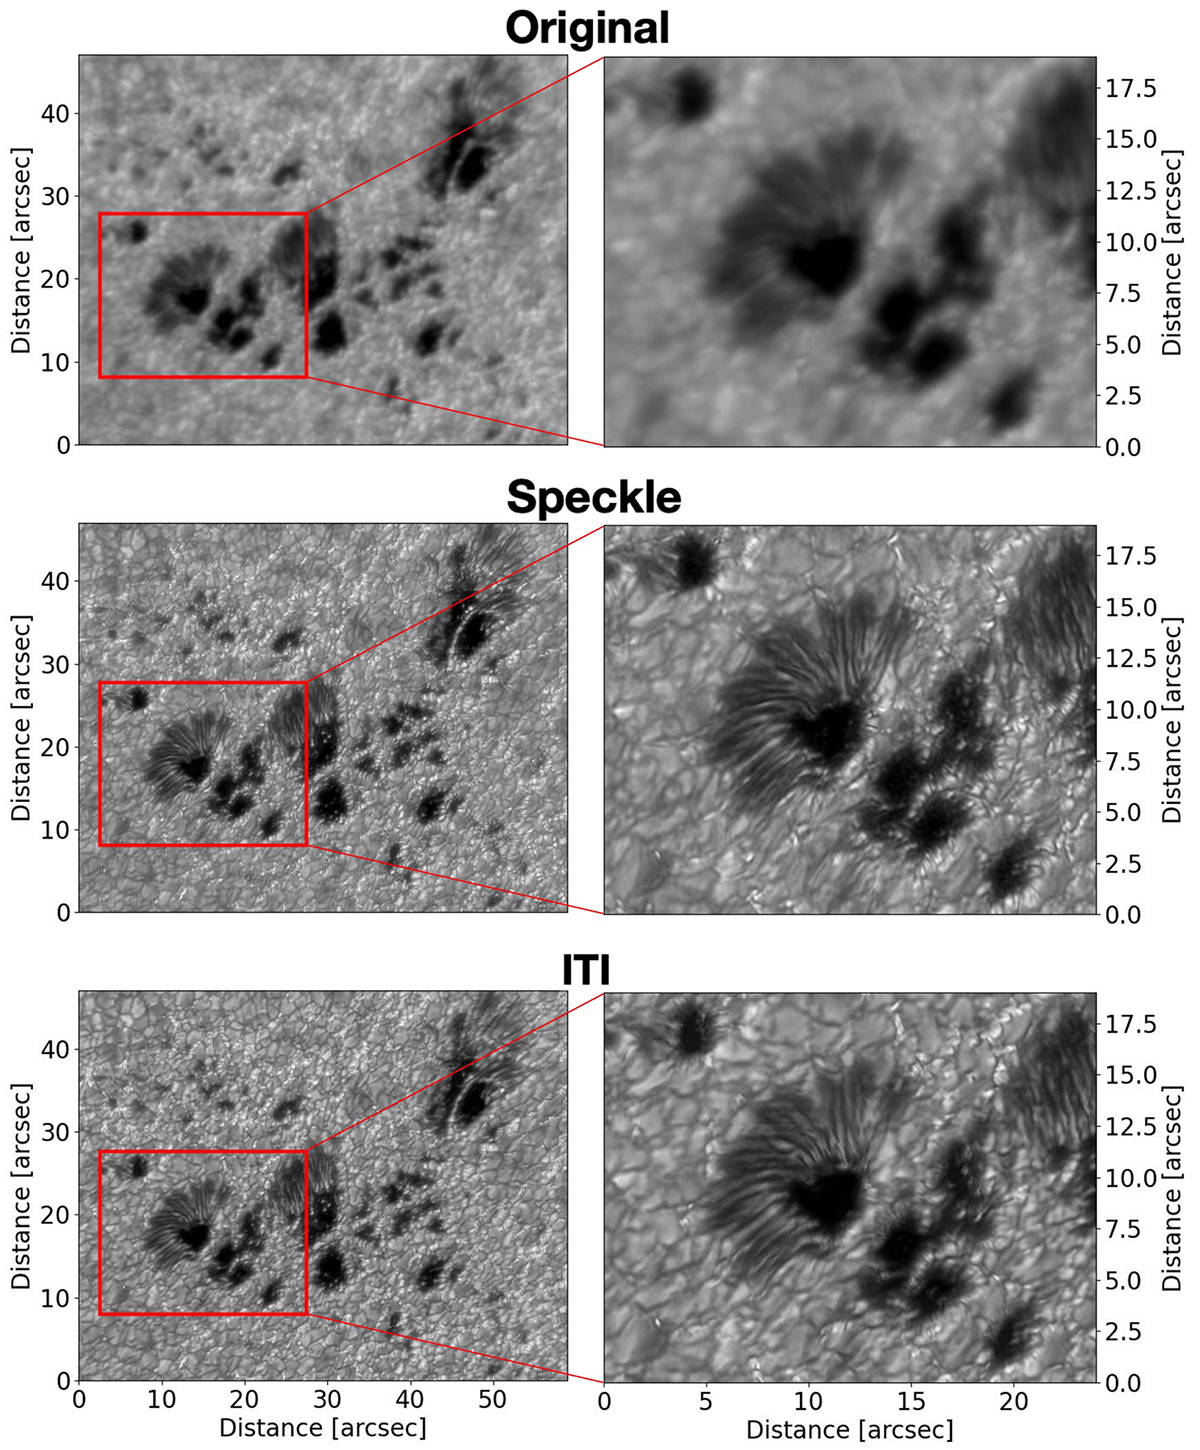
Fig. 5.
Download original image
Comparison between a single frame of an original image burst, the speckle reconstruction, and our ITI reconstruction from a G-band observation on 11 April 2016. In the first row, a single frame of the burst is shown with a zoomed-in view marked with a red rectangle. The second row shows the corresponding speckle reconstruction. In the third row, we visualize the restoration of our ITI method, again with a zoomed-in view covering the same spatial region.
Current usage metrics show cumulative count of Article Views (full-text article views including HTML views, PDF and ePub downloads, according to the available data) and Abstracts Views on Vision4Press platform.
Data correspond to usage on the plateform after 2015. The current usage metrics is available 48-96 hours after online publication and is updated daily on week days.
Initial download of the metrics may take a while.