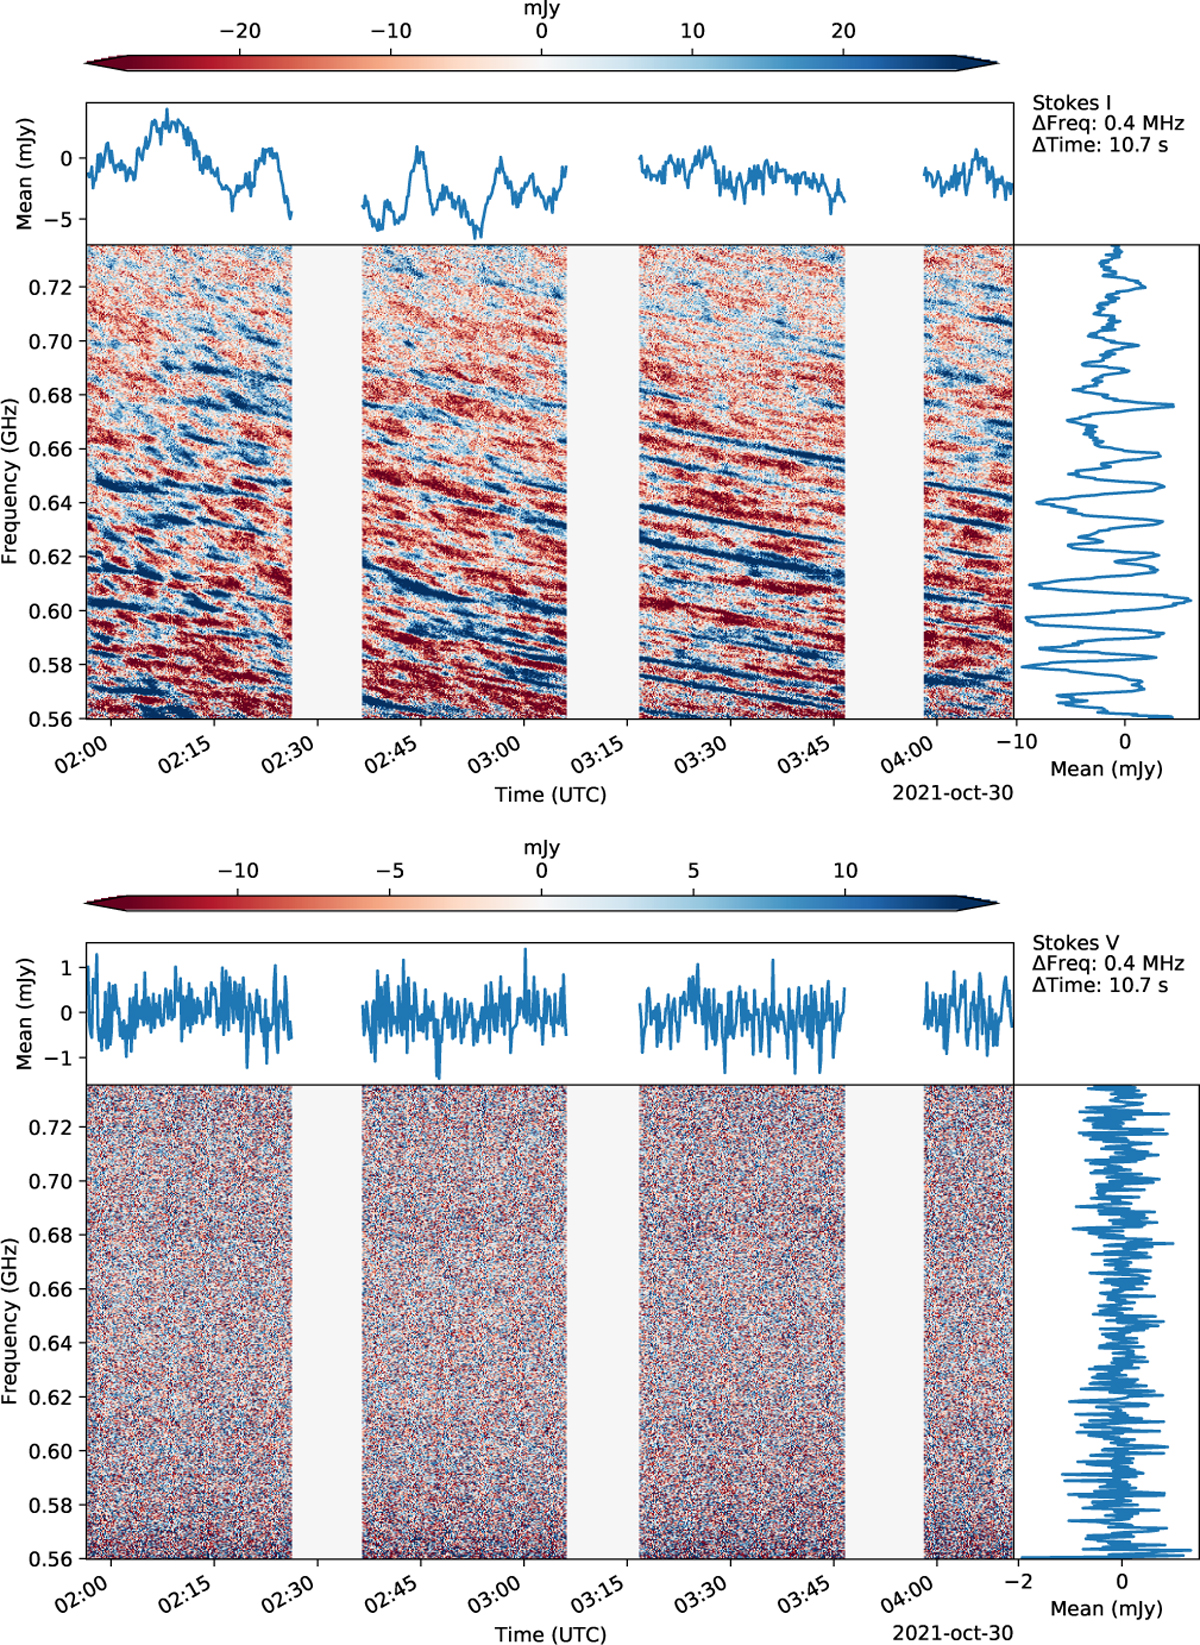
Fig. 3
Download original image
Dynamic spectrum of the Stokes I and V (upper and lower panels, respectively) emission from the GJ 486–GJ 486b system for our 30 October 2021 uGMRT observations in band 4, averaged in frequency (Δ ν = 0.4 MHz). The time interval used is 10.7 s (which is the integration time). There is no apparent detection of radio emission above the noise. Blank regions correspond to times when we observed the phase calibrator. The spectra at the top and right of the dynamic spectrum result from collapsing all channels (top) and times (right). For a box located on a time range from 2:00 to 2:20 and a frequency range from 0.68 to 0.72 GHz. The rms values are 13.5 and 8.4 mJy for the Stokes I and V spectra, respectively.
Current usage metrics show cumulative count of Article Views (full-text article views including HTML views, PDF and ePub downloads, according to the available data) and Abstracts Views on Vision4Press platform.
Data correspond to usage on the plateform after 2015. The current usage metrics is available 48-96 hours after online publication and is updated daily on week days.
Initial download of the metrics may take a while.