Fig. 8.
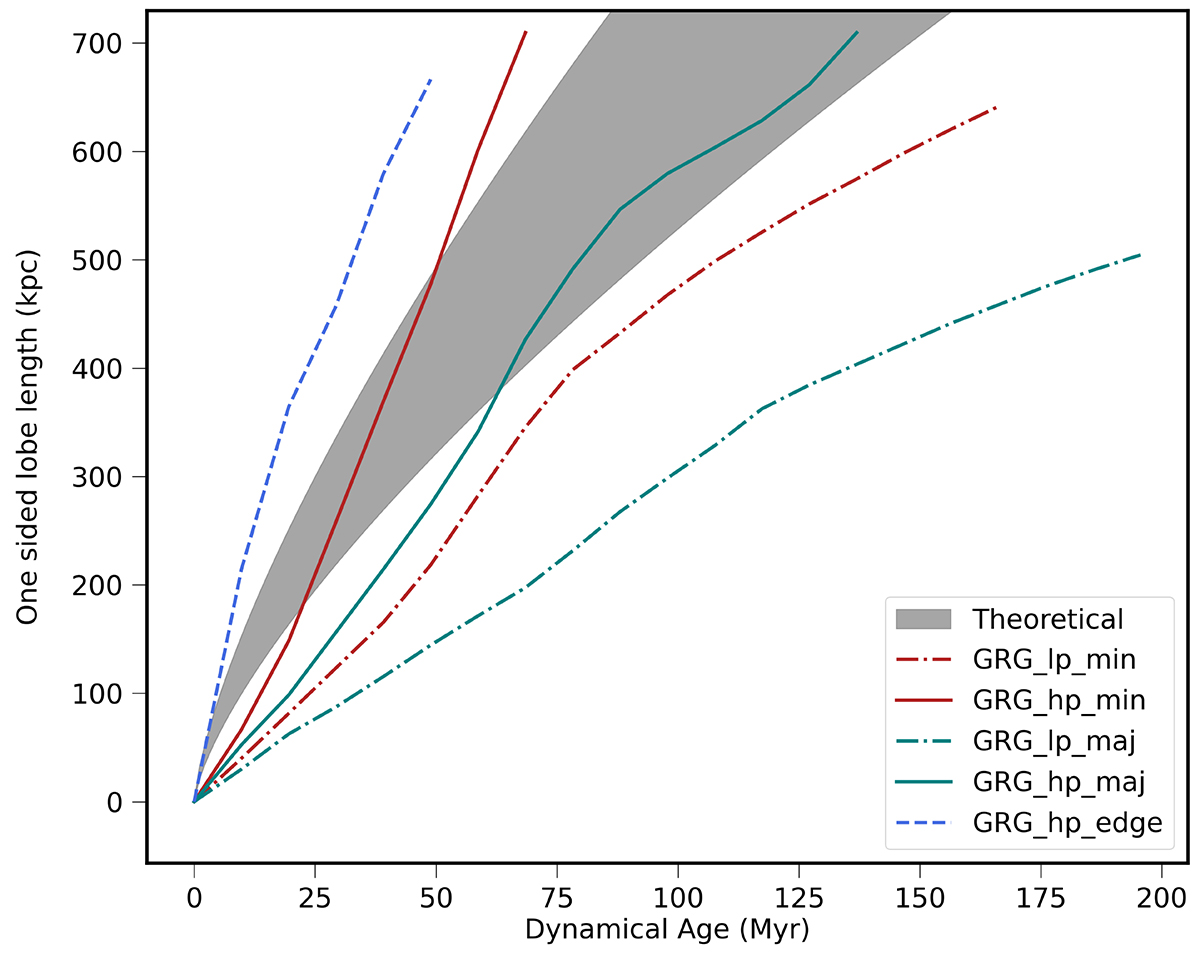
Download original image
Development of cocoon length over the course of evolution for the five simulation cases considered in this work. The shaded region represents the theoretically allowed zones in the length-age diagram for the extended parameter space considered across the simulations. A diverse set of behavior compared to theoretical predictions has been observed here, as discussed in Sect. 3.2.2. Notably, the blue dashed line represents the case where the jet grows at the outskirts of the ambient medium, thereby, propagating faster than the theoretical predictions.
Current usage metrics show cumulative count of Article Views (full-text article views including HTML views, PDF and ePub downloads, according to the available data) and Abstracts Views on Vision4Press platform.
Data correspond to usage on the plateform after 2015. The current usage metrics is available 48-96 hours after online publication and is updated daily on week days.
Initial download of the metrics may take a while.