Fig. 2.
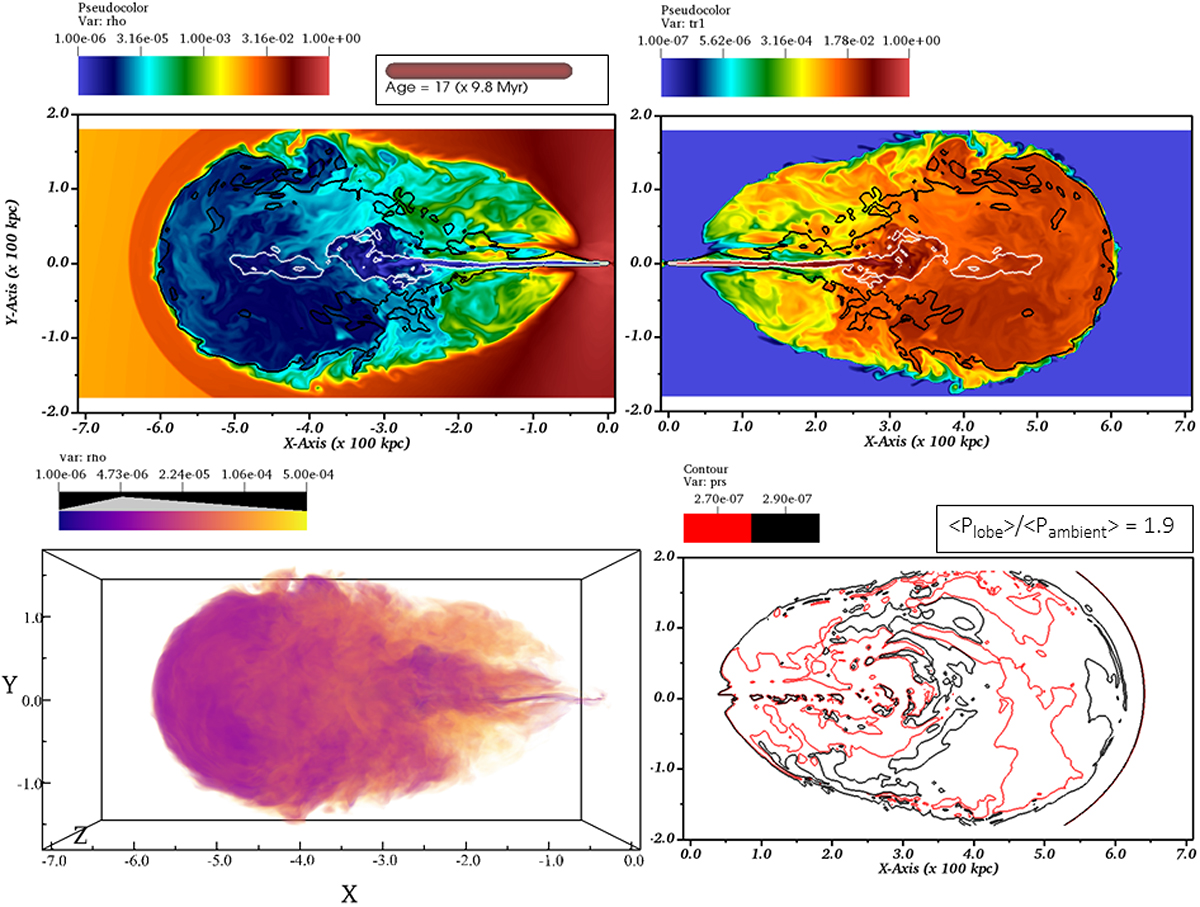
Download original image
Simulation “GRG_lp_min” (low-powered jet propagating along the minor axis of the environment) showcasing the structure of the evolved GRG at the highlighted age. Top-left panel: x − y variation of (ρ/ρ0), accompanied by contours of velocity (0.1c for white, 0.01c for black). Top-right panel: Tracer distribution showing regions with jet material and their associated fraction. The highest color bar value indicates a grid cell completely filled with jet material (flipped for better visualization), and the contours represent the same velocities as earlier. Bottom-left panel: Three-dimensional representation of (ρ/ρ0) of the lobe, providing finer details with an extra dimension. Bottom-right panel: Contours of pressure values (Plobe/P0) indicating a minimal variation inside the cocoon (flipped for better visualization). The cocoon also appears to be overpressured compared to the ambient medium, as indicated by the ratio above the subplot. Here, ρ0 = 0.001 amu/cc, P0 = 1.5 × 10⁻⁶ dyn/cm2, and length is represented compared to L0 = 100 kpc. Details are given in Sect. 3.1.1.
Current usage metrics show cumulative count of Article Views (full-text article views including HTML views, PDF and ePub downloads, according to the available data) and Abstracts Views on Vision4Press platform.
Data correspond to usage on the plateform after 2015. The current usage metrics is available 48-96 hours after online publication and is updated daily on week days.
Initial download of the metrics may take a while.