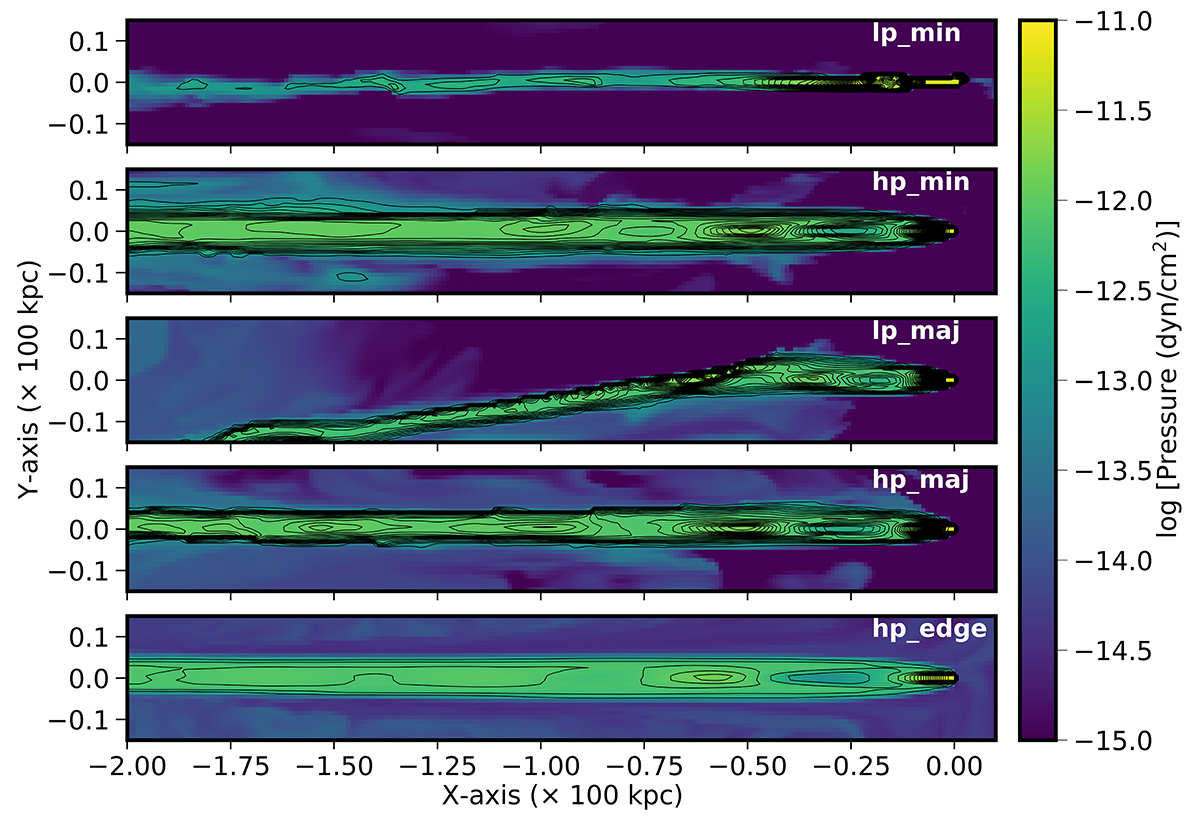
Fig. B.1.
Download original image
Two-dimensional slices of pressure values (indicated by the color bar) are plotted in the x − y (z = 0) plane, with a zoom-in of the jet beam region, showing the developed structures of the five primary simulations from Table 1 at their respective evolutionary stages, as seen in Fig. 2 - 6 (with each case labeled in the subplots). Pressure contours in black solid-lines have been overlaid to illustrate the complex pressure distribution within the jet beam, highlighting zones of compression and rarefaction. This approach helps visualize the formation of recollimation shocks, particularly prominent in high-powered jet cases. In lower-powered jets, these shocks are noticeable in early evolution length-scales, though compression zones continue to appear as the jets undergo bending. This analysis also reveals that the jet beam expands across multiple grid zones shortly after injection, effectively reducing the impact of resolution constraints.
Current usage metrics show cumulative count of Article Views (full-text article views including HTML views, PDF and ePub downloads, according to the available data) and Abstracts Views on Vision4Press platform.
Data correspond to usage on the plateform after 2015. The current usage metrics is available 48-96 hours after online publication and is updated daily on week days.
Initial download of the metrics may take a while.