Open Access
Fig. A.1.
Download original image
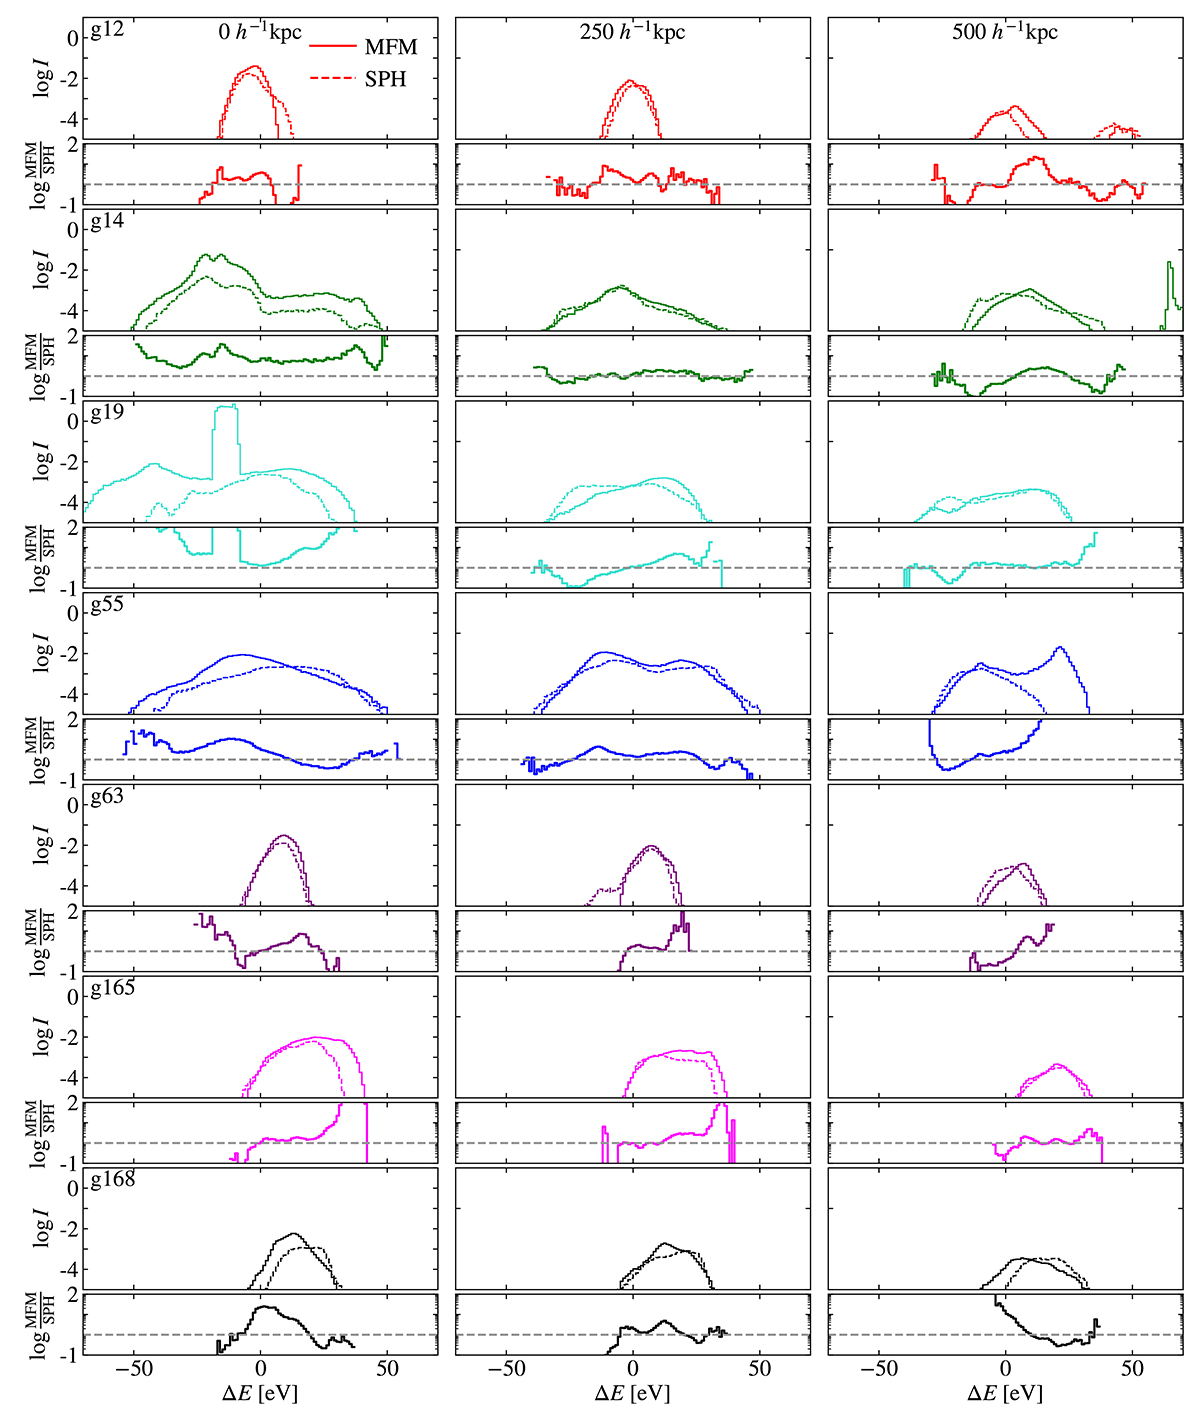
Line profiles of a 6.702 keV iron line for the different clusters at different distances from the cluster center (as written in each of the top panels). The intensity is in arbitrary units. For each panel, we also calculate the ratio between intensity for MFM and SPH to emphasize smaller differences.
Current usage metrics show cumulative count of Article Views (full-text article views including HTML views, PDF and ePub downloads, according to the available data) and Abstracts Views on Vision4Press platform.
Data correspond to usage on the plateform after 2015. The current usage metrics is available 48-96 hours after online publication and is updated daily on week days.
Initial download of the metrics may take a while.