Open Access
Fig. 4.
Download original image
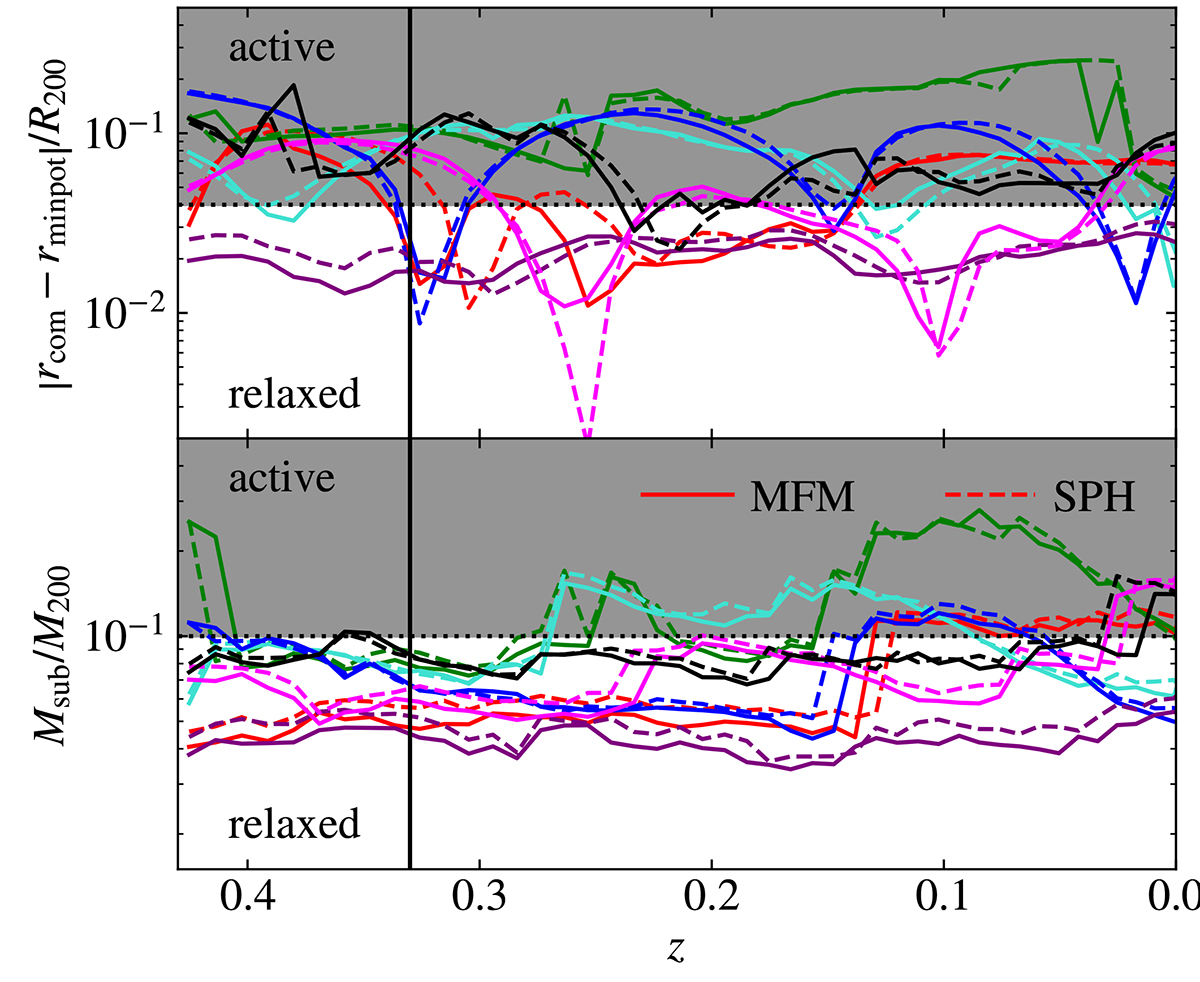
Evolution of the center offset and substructure-mass over time of all clusters analyzed in this work. As is described in Sect. 3.1, a cluster is classified as relaxed only if both lines are below the two dotted thresholds, and otherwise as active. The colors of the clusters are the same as in Fig. 2.
Current usage metrics show cumulative count of Article Views (full-text article views including HTML views, PDF and ePub downloads, according to the available data) and Abstracts Views on Vision4Press platform.
Data correspond to usage on the plateform after 2015. The current usage metrics is available 48-96 hours after online publication and is updated daily on week days.
Initial download of the metrics may take a while.