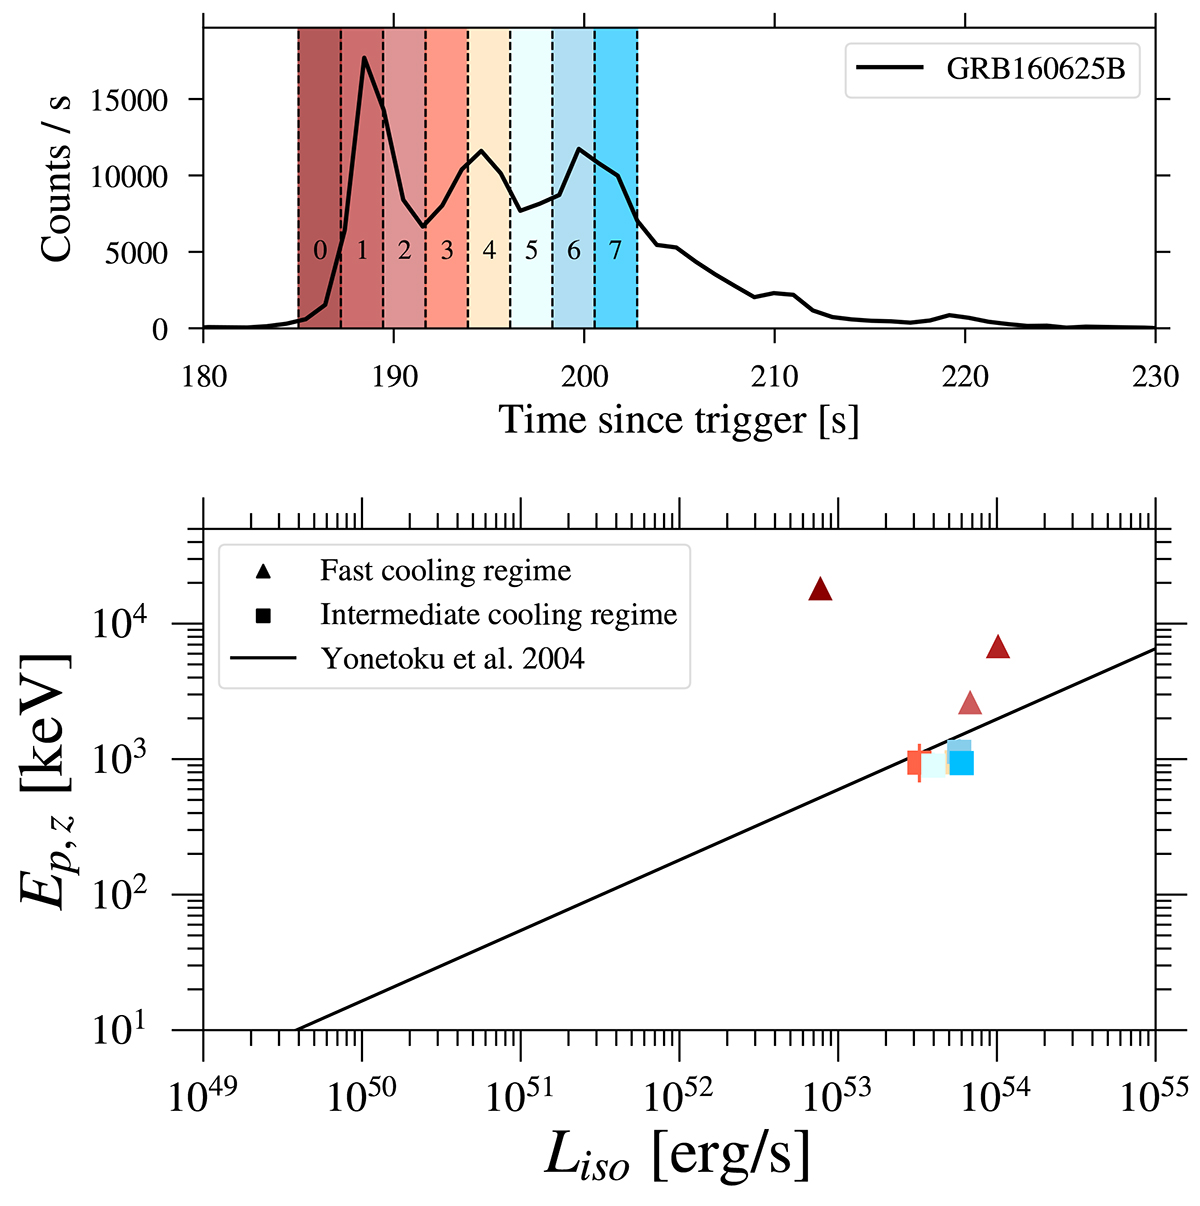
Fig. 5.
Download original image
Fermi/GBM (8–900 keV) light curve and time bins of the associated time-resolved analysis of GRB160625B (upper panel). In the lower panel, we show the relative Ep,z−Liso plane. The color scale is associated with the time bin in which the spectral analysis was performed. We show, for this GRB, the results of the synchrotron fit, and we represent the bins with fast-cooling spectra as triangles, and the bins with intermediate-cooling spectra as squares. The straight black line represents the Yonetonu relation obtained from Yonetoku et al. (2004).
Current usage metrics show cumulative count of Article Views (full-text article views including HTML views, PDF and ePub downloads, according to the available data) and Abstracts Views on Vision4Press platform.
Data correspond to usage on the plateform after 2015. The current usage metrics is available 48-96 hours after online publication and is updated daily on week days.
Initial download of the metrics may take a while.