Fig. 4.
Download original image
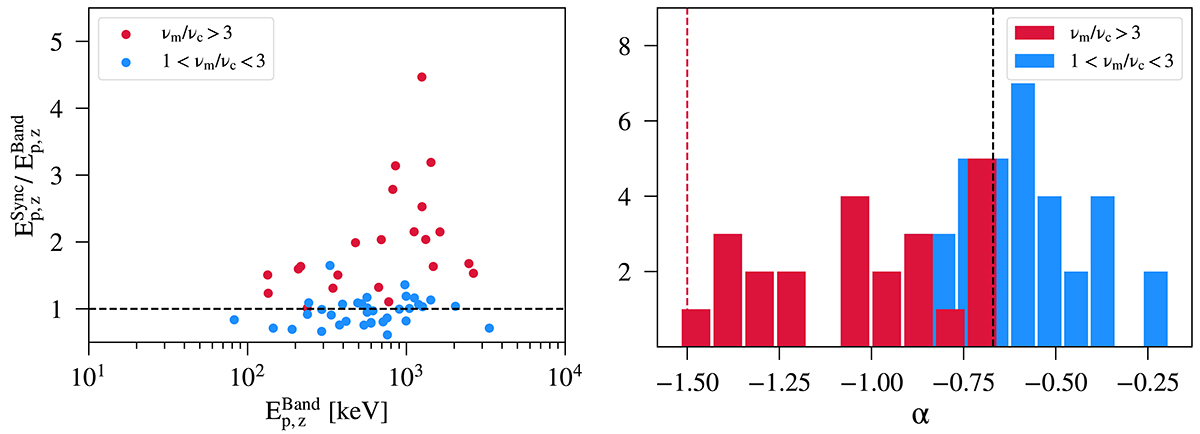
Ratio between the rest-frame peak energy from synchrotron model fits, ![]() , and Band model fits,
, and Band model fits, ![]() , as a function of
, as a function of ![]() (left-hand panel) and low-energy break, α, histograms (right-hand panel), both relative to GRBs in the synchrotron single-bin sample. Parameters from GRBs associated with fast-cooling spectra (νm/νc > 3) are shown in red, while the ones associated with intermediate-cooling spectra (1< νm/νc < 3) are shown in blue.
(left-hand panel) and low-energy break, α, histograms (right-hand panel), both relative to GRBs in the synchrotron single-bin sample. Parameters from GRBs associated with fast-cooling spectra (νm/νc > 3) are shown in red, while the ones associated with intermediate-cooling spectra (1< νm/νc < 3) are shown in blue.
Current usage metrics show cumulative count of Article Views (full-text article views including HTML views, PDF and ePub downloads, according to the available data) and Abstracts Views on Vision4Press platform.
Data correspond to usage on the plateform after 2015. The current usage metrics is available 48-96 hours after online publication and is updated daily on week days.
Initial download of the metrics may take a while.