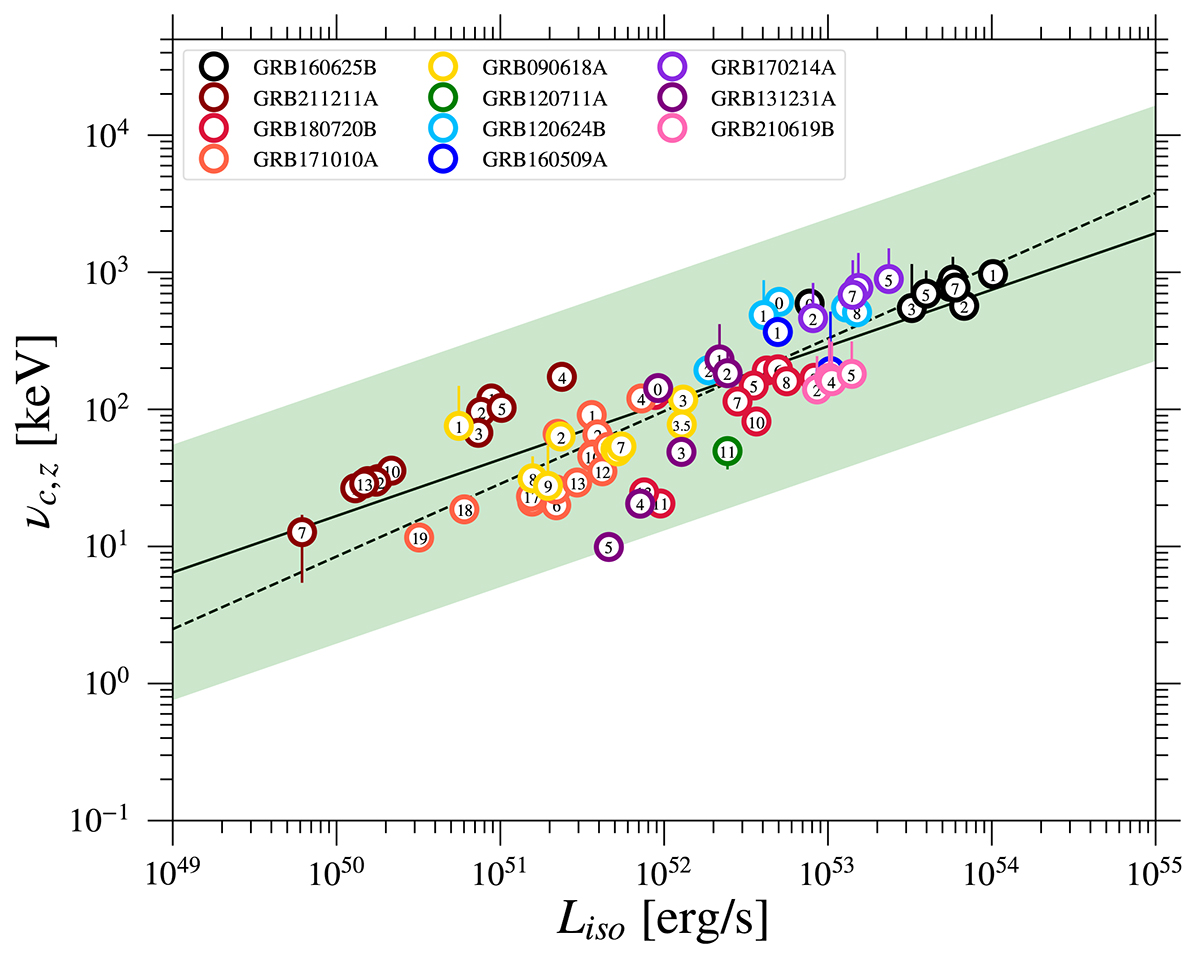
Fig. 3.
Download original image
νc, z − Liso relation obtained from the synchrotron GRBs in the multi-bin sample. We show multiple time bins from different GRBs with circles of the same colors. The number inside the circles represents the bin number that data point is associated with. The straight black line represents the best-fit line from the linear fit, while the dashed-line the best-fit line obtained from the νc, z − Liso relation in the single-bin sample. The green-shaded area shows the 3σ scatter region of the relation.
Current usage metrics show cumulative count of Article Views (full-text article views including HTML views, PDF and ePub downloads, according to the available data) and Abstracts Views on Vision4Press platform.
Data correspond to usage on the plateform after 2015. The current usage metrics is available 48-96 hours after online publication and is updated daily on week days.
Initial download of the metrics may take a while.