Fig. 1.
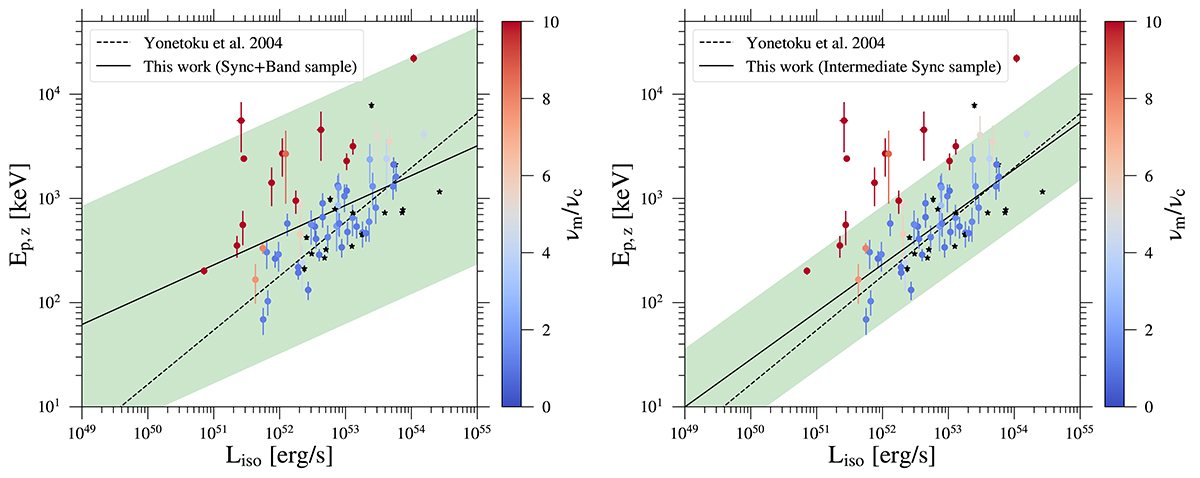
Download original image
Yonetoku relation obtained from the single-bin sample. Black stars represent GRBs from the Band subsample, while colored dots represent GRBs from the synchrotron subsample. The color scale is associated with the frequency ratio, νm/νc, derived from the synchrotron fit. We fit a power law to the whole single-bin sample (left-hand panel) and to the GRBs in the synchrotron subsample in an intermediate cooling regime (right-hand panel). The straight black line represents the best-fit line from the linear fit, and the green-shaded area the relative 3σ scatter region. For comparison, the dashed black line represents the best-fit line from Yonetoku et al. (2004).
Current usage metrics show cumulative count of Article Views (full-text article views including HTML views, PDF and ePub downloads, according to the available data) and Abstracts Views on Vision4Press platform.
Data correspond to usage on the plateform after 2015. The current usage metrics is available 48-96 hours after online publication and is updated daily on week days.
Initial download of the metrics may take a while.