Fig. 7
Download original image
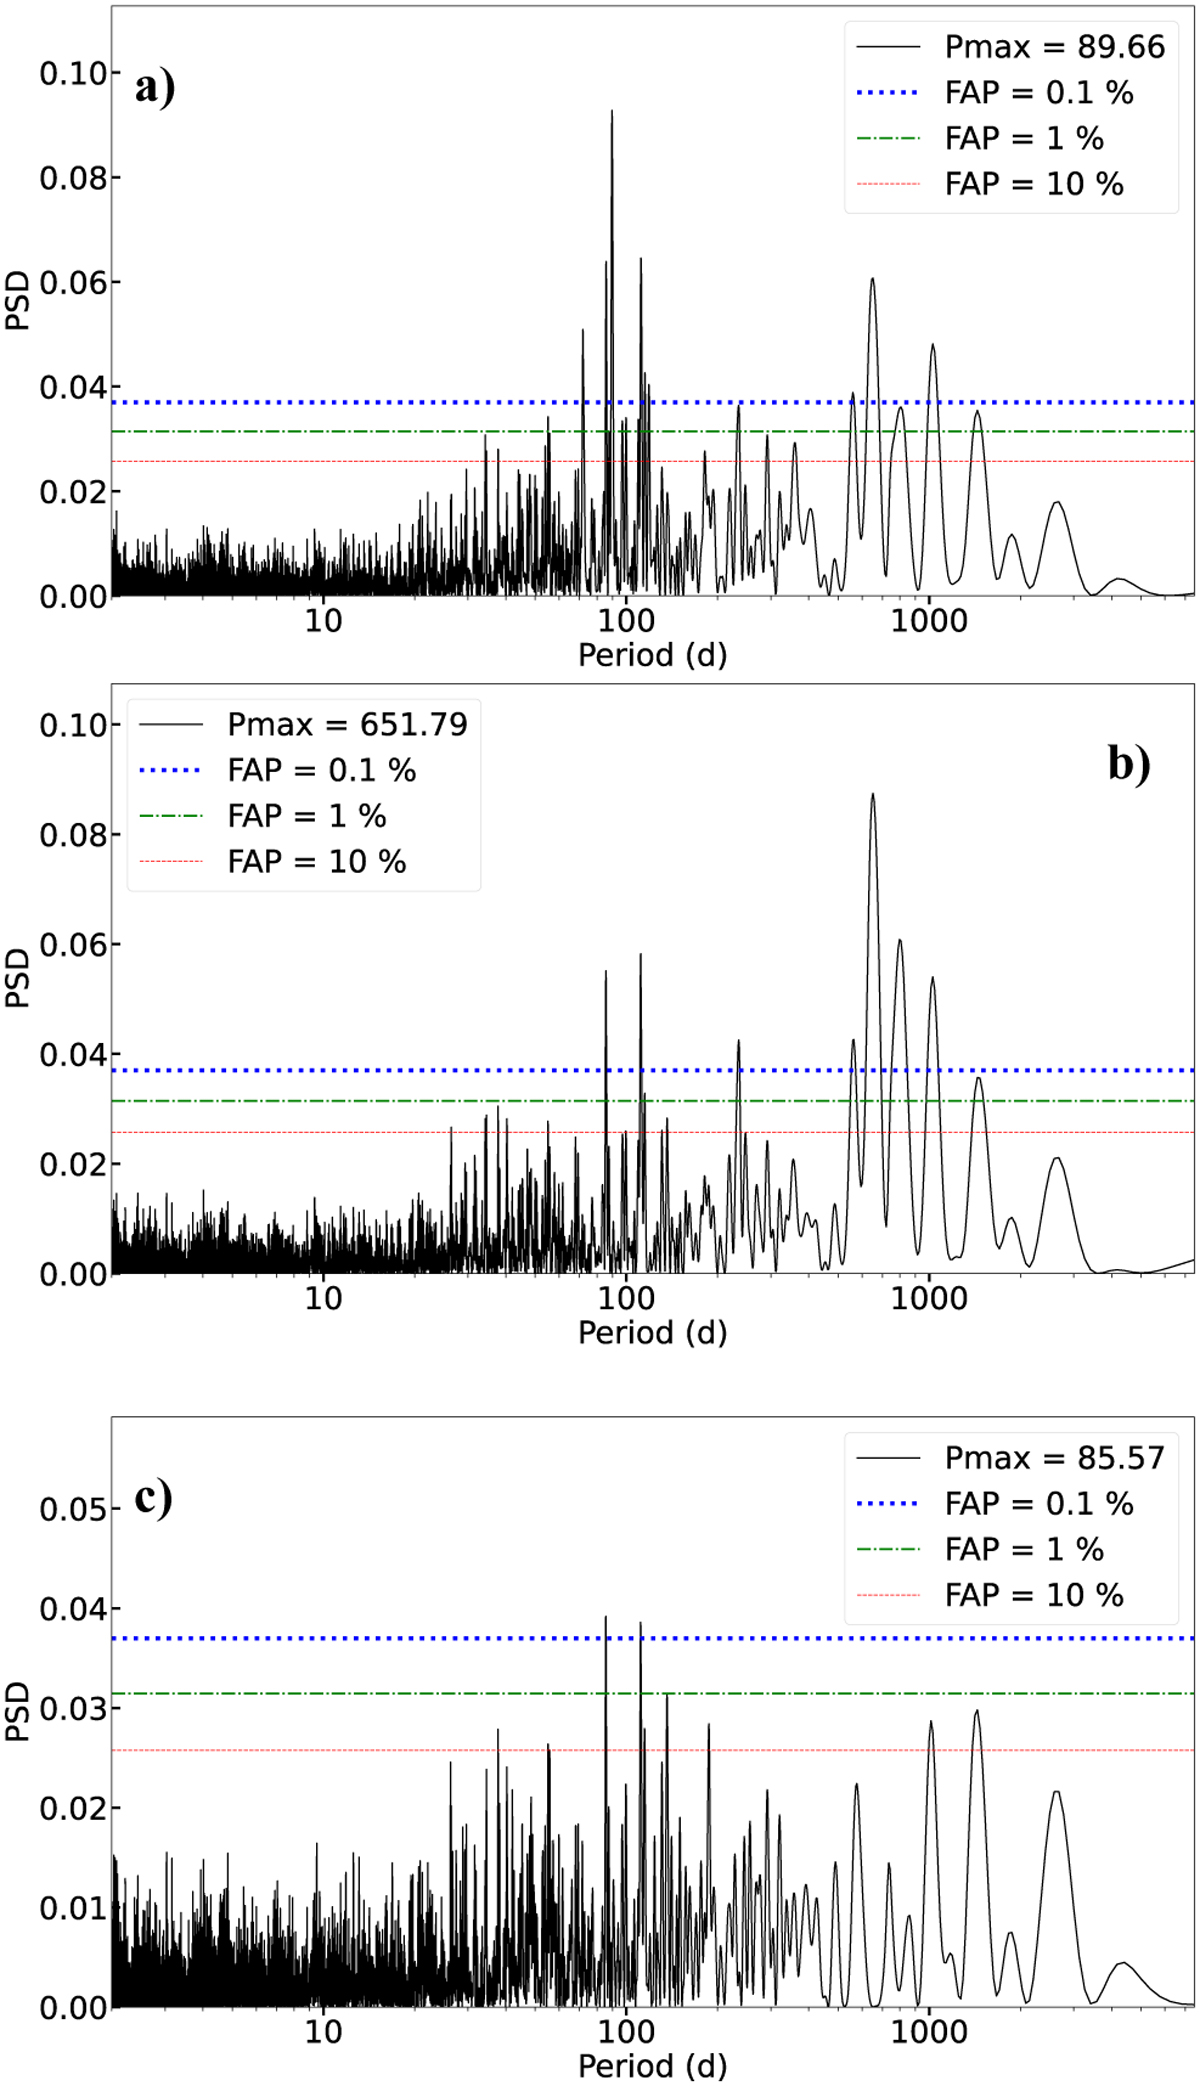
Analysis of the residuals time series after planetary signals subtraction. Panel a: GLS periodogram of the residuals after subtracting the 18.3 d signal. A peak at ~89 d and another one at ~650 d are visible. Panel b: GLS periodogram of the residuals after subtracting the 18.3 d and 89.6 d signals. A peak at ~650 d is visible. Panel (c): GLS periodogram of the residuals after subtracting the 18.314, 650.9, and 89.65 d signals. We see some additional peaks in the periodogram of the residuals with FAP < 0.1% at periods of ~85 and 111 d.
Current usage metrics show cumulative count of Article Views (full-text article views including HTML views, PDF and ePub downloads, according to the available data) and Abstracts Views on Vision4Press platform.
Data correspond to usage on the plateform after 2015. The current usage metrics is available 48-96 hours after online publication and is updated daily on week days.
Initial download of the metrics may take a while.