Fig. 4
Download original image
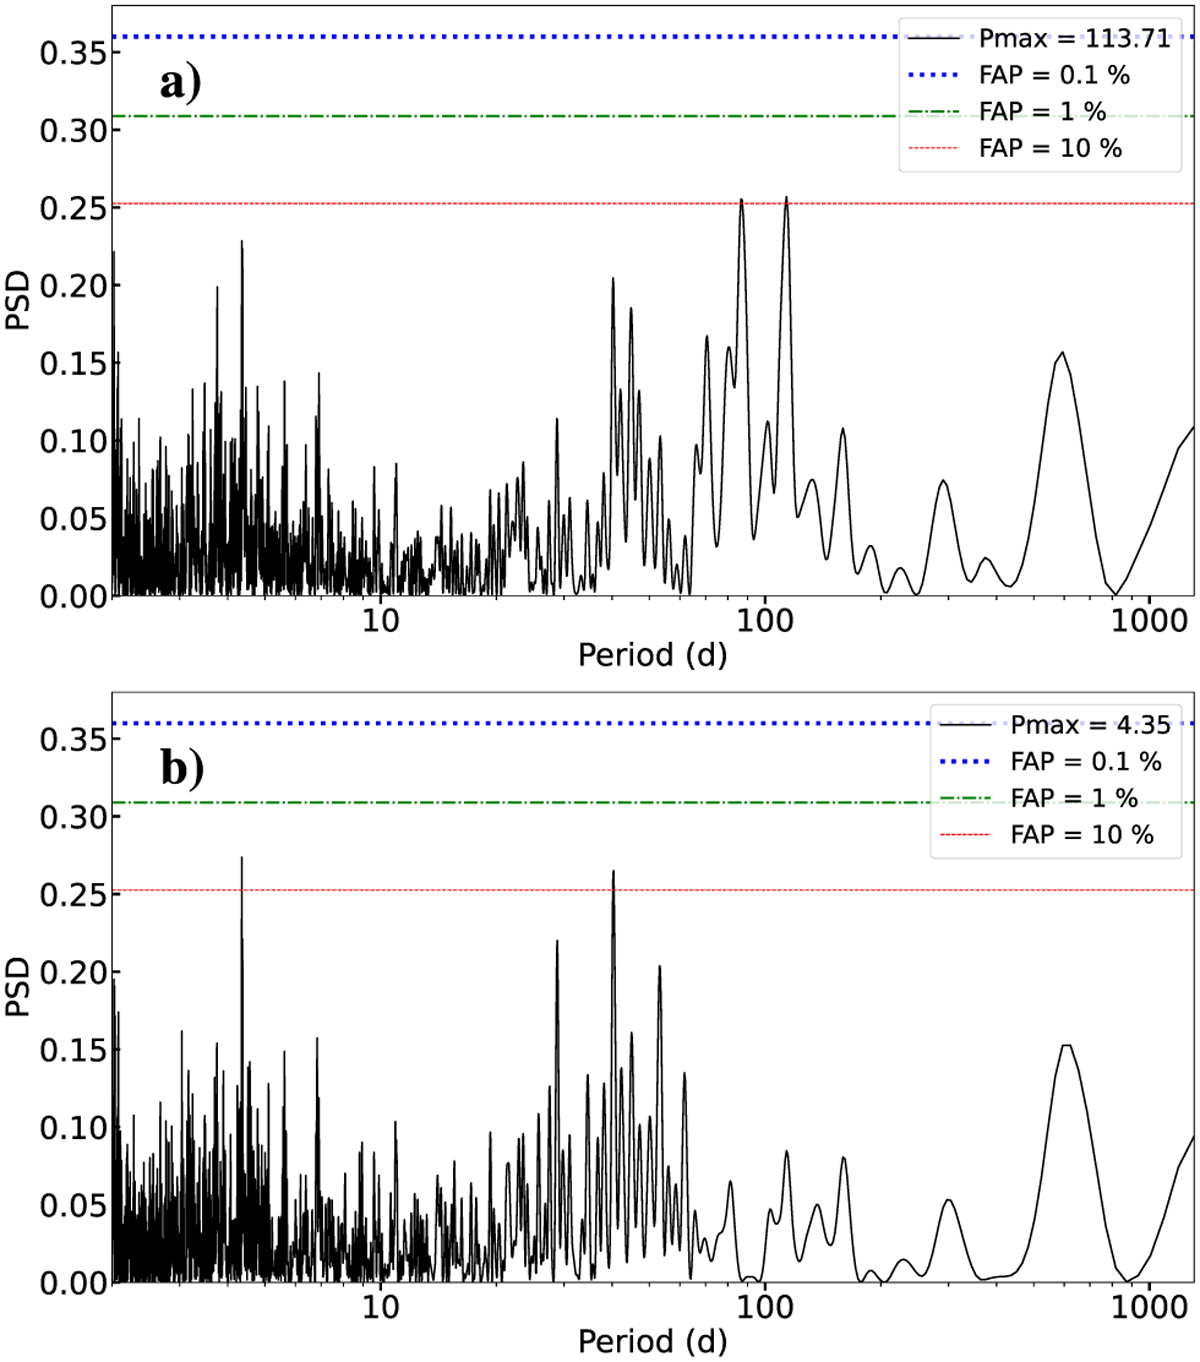
Analysis of the ESPRESSO residual time series. Panel a: GLS periodogram of the residuals of ESPRESSO RVs for HD 20794 once we subtract the signal at 18.3 d. We can see a double peak at 87 and 113 d, one peak being the 1 year alias of the other. Panel (b): GLS periodogram of the residuals of ESPRESSO RVs for HD 20794 after subtracting the signals at 18.3 d and 87 d. We can see some peaks at 4 and 40 d. The peak at 4 d probably comes from the sampling, while the peak at 40 d could be a signature of the stellar rotation period.
Current usage metrics show cumulative count of Article Views (full-text article views including HTML views, PDF and ePub downloads, according to the available data) and Abstracts Views on Vision4Press platform.
Data correspond to usage on the plateform after 2015. The current usage metrics is available 48-96 hours after online publication and is updated daily on week days.
Initial download of the metrics may take a while.