Fig. E.11
Download original image
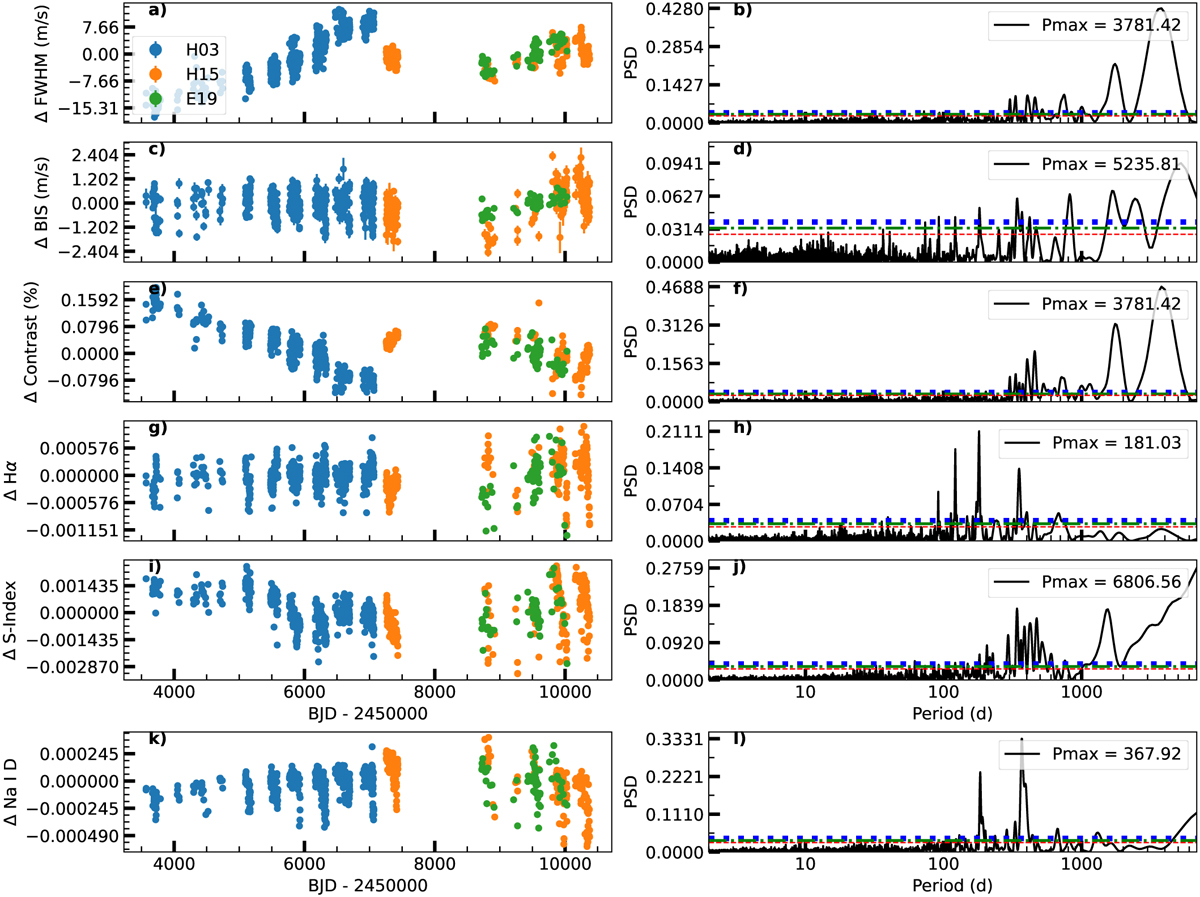
Activity indicators time series derived before the YARARA correction. Panel (a): FWHM time series. It is possible to see trends in the different datasets. For H03 we have a trend with the change of focus of the instrument, while for H15 and E19 we have a linear correlation with the temperature of the echelle gratings. Panel (b): GLS periodogram for FWHM. Panel (c): BIS time series. It is possible to see a linear trend in E19 and H15. Panel (d): GLS periodogram for BIS. Panel (e): Time series of Contrast. Panel (f): GLS periodogram of Contrast. Panel (g): Hα time series. Panel (h): GLS periodogram of Hα. Panel (i): S-index time series. Panel (j): GLS periodogram of S-index. Panel (k): Na I D time series. Panel (l): GLS periodogram of Na I D. The red/green/blue horizontal dashed lines indicate FIP levels of 10/1/0.1 % respectively.
Current usage metrics show cumulative count of Article Views (full-text article views including HTML views, PDF and ePub downloads, according to the available data) and Abstracts Views on Vision4Press platform.
Data correspond to usage on the plateform after 2015. The current usage metrics is available 48-96 hours after online publication and is updated daily on week days.
Initial download of the metrics may take a while.