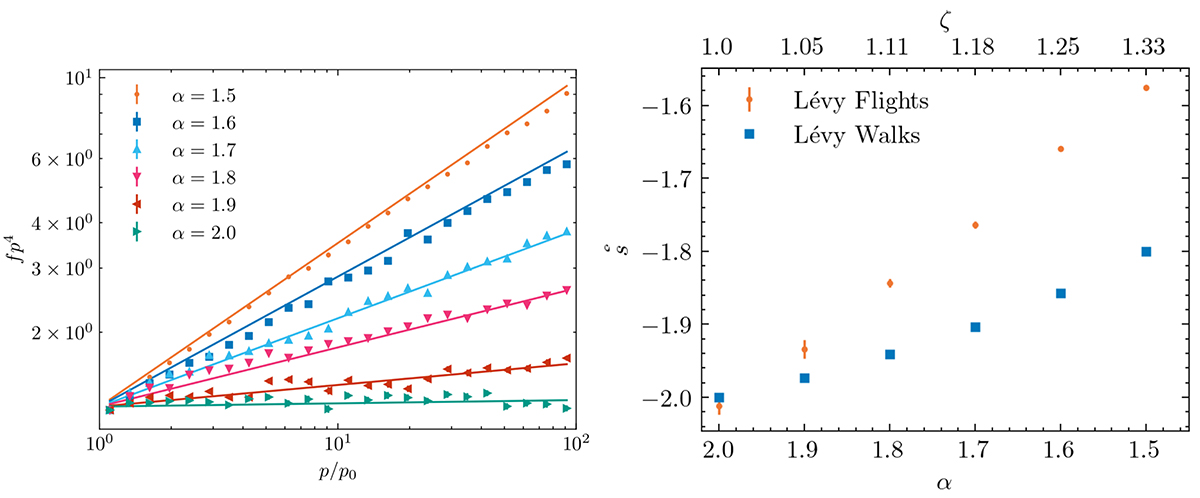
Fig. 4.
Download original image
Stationary spectra for p < = 100p0 for different fractional dimension α considering Lévy flights. On the left, the resulting energy spectra are shown. The dots are simulation results, and lines indicate the slopes fitted to the range p = (10, 100)p0. The fitted slopes are shown in comparison to the slopes for Lévy walks in the right panel, depending on the fractional dimension α and (pseudo) mean-square displacement. The fitted values for the Lévy flights are (with decreasing fractional dimension): s = −2.012 + −0.004, s = −1.934 ± 0.003, s = −1.844 ± 0.005 s = −1.764 ± 0.005, s = −1.659 ± 0.013, s = −1.576 ± 0.012.
Current usage metrics show cumulative count of Article Views (full-text article views including HTML views, PDF and ePub downloads, according to the available data) and Abstracts Views on Vision4Press platform.
Data correspond to usage on the plateform after 2015. The current usage metrics is available 48-96 hours after online publication and is updated daily on week days.
Initial download of the metrics may take a while.