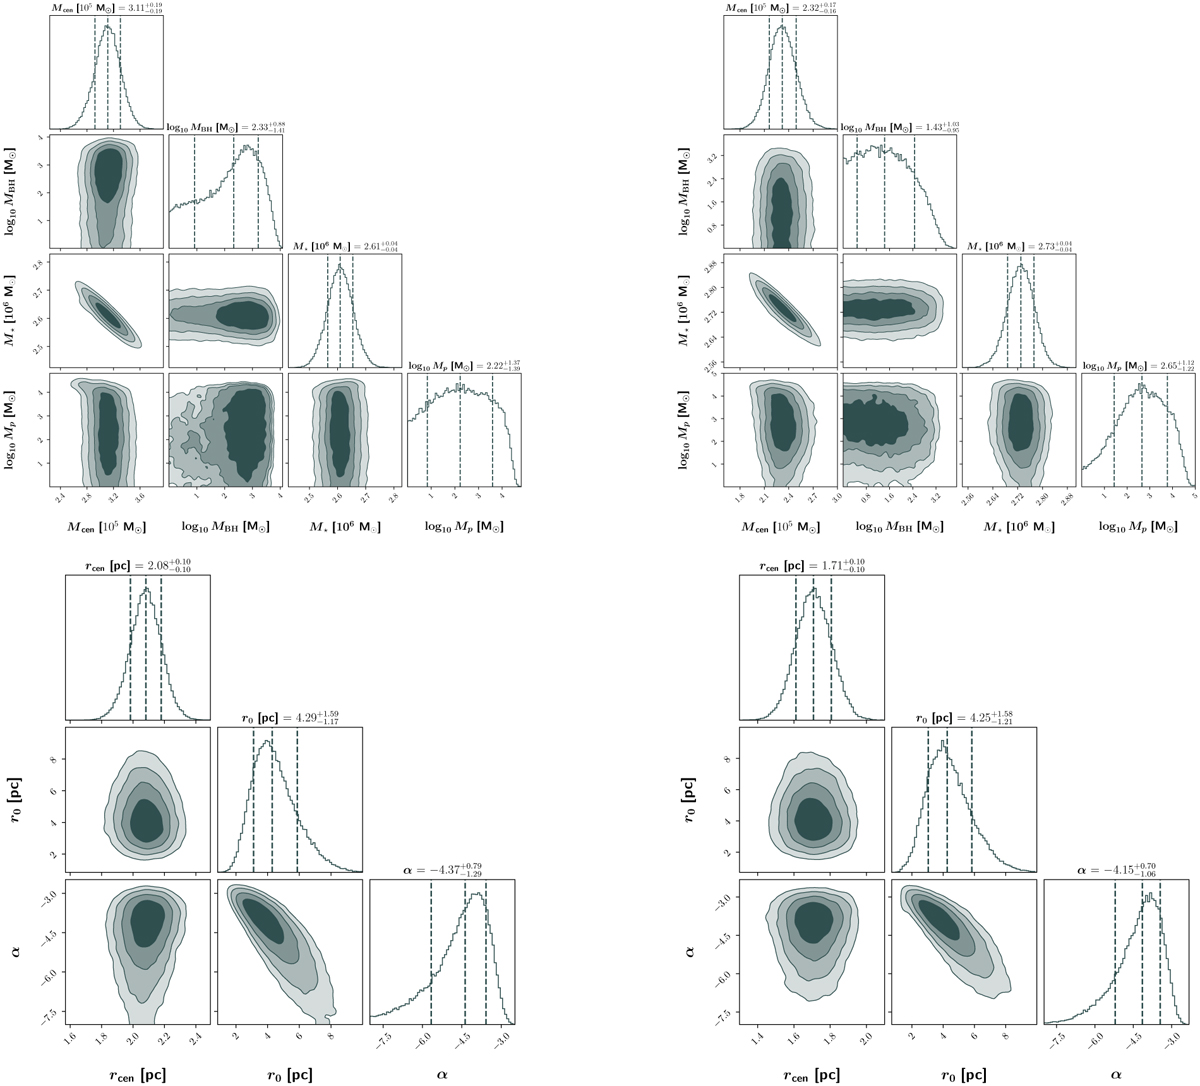
Fig. C.1
Download original image
Upper-left: Posterior distributions for the mass components considered in our kinematic models using the Noy10 center. The median of the central mass component for the And center, is ~ 15% lower, consistent with a more extended central mass distribution for the Noy10 center. The stellar mass obtained is only marginally smaller (≲ 3%), with the other IMBH and MSP components remaining subdominant without significant statistically meaningful differences. Upper-right: Same as the upper-left plot, but for the Noy08 center. In this case, the central mass for our main analysis with the And center is ~ 14% higher than the result shown, consistent with a more concentrated distribution for the Noy08 center, although still with the 1σ CL regions overlapping each other. A small increase of ≲ 2% is observed with respect to the stellar mass value, but these central values lie within their respective 1σ CL regions. The IMBH and MSP mass components, once more, show approximate consistency with the previous results.† Lower-left: Posterior distributions of the morphological parameters for the mass models using the Noy10 center. The median of the scale radius using the And center is ~ 11% lower, indicating a somewhat more extended central mass distribution for the Noy10 center, with the 1σ CL regions barely overlapping each other. The MSP parameters agree at the 1σ level. Lower-right: Same as the middle-left plot, but for the Noy08 center. In this case, the median of the scale radius using the And center is ~ 10% greater, indicating a somewhat more concentrated central mass distribution, but still showing 1σ CL compatibility. As with the Noy10 center, the MSP parameters show 1σ level consistency with the And center results.
† Marginal differences in the morphology of the posterior distributions of the IMBH and MSP masses are not necessarily statistically meaningful, owing to the fact that, due to being inherently less constrained, these may require additional independent runs to fully establish such differences (which we did perform for the case of the And center). This, however, is not necessary for the purposes of the complementary analysis presented in this appendix.
Current usage metrics show cumulative count of Article Views (full-text article views including HTML views, PDF and ePub downloads, according to the available data) and Abstracts Views on Vision4Press platform.
Data correspond to usage on the plateform after 2015. The current usage metrics is available 48-96 hours after online publication and is updated daily on week days.
Initial download of the metrics may take a while.