Fig. 4
Download original image
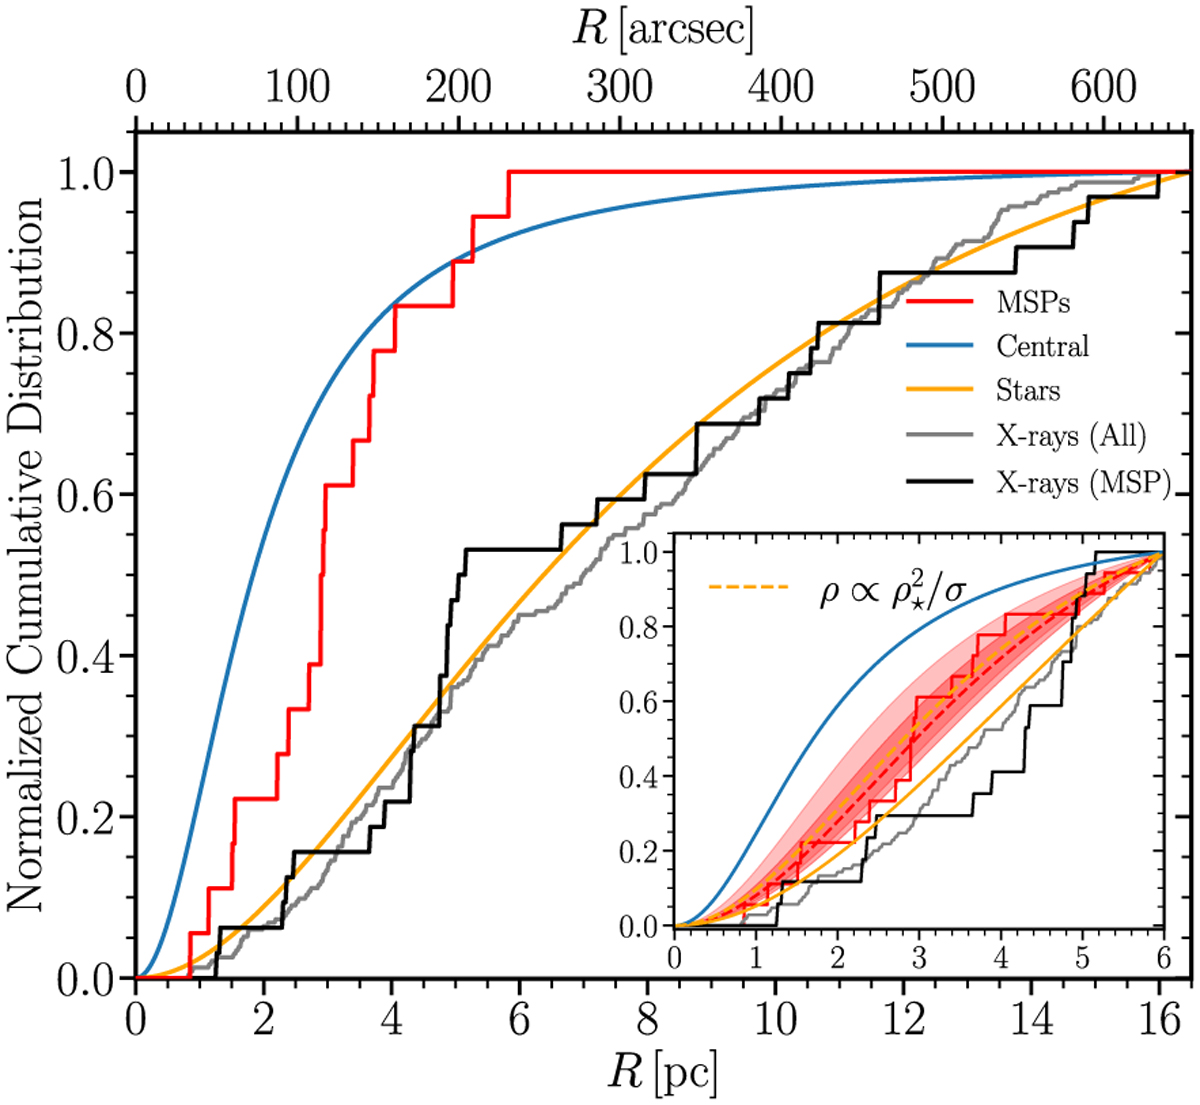
Normalized cumulative distributions of MSPs (red), the more concentrated central mass emulating heavier stellar remnants (blue), stars (yellow), and X-ray-emitting sources (black and gray) in ω Cen as a function of projected radius. The inset shows a close-up view of the distribution normalized at a smaller radius, where all of the 18 MSPs are located. The inset includes the 68 and 95% CL regions of the MSP profile fit (shaded bands). The red dashed line denotes the median of the inferred cumulative distribution from the MSP 3D density from Eq. (30). The dashed-orange line indicates the predicted distribution derived from the stellar encounter rate that provides a remarkable match to the MSP distribution. We also show counts of X-ray sources observed in ω Cen studied by Henleywillis et al. (2018), showing the total count of 233 objects (black) and a subset of ~32 of the objects that share luminosities and X-ray colors compatible with known MSPs from other GCs (gray), as presented in Figure 10 of Heinke et al. (2005) (see also the discussion in Henleywillis et al. 2018). Over the radial range of the inset figure, this count is reduced to 105 and ~17 sources, respectively.
Current usage metrics show cumulative count of Article Views (full-text article views including HTML views, PDF and ePub downloads, according to the available data) and Abstracts Views on Vision4Press platform.
Data correspond to usage on the plateform after 2015. The current usage metrics is available 48-96 hours after online publication and is updated daily on week days.
Initial download of the metrics may take a while.