Fig. 3
Download original image
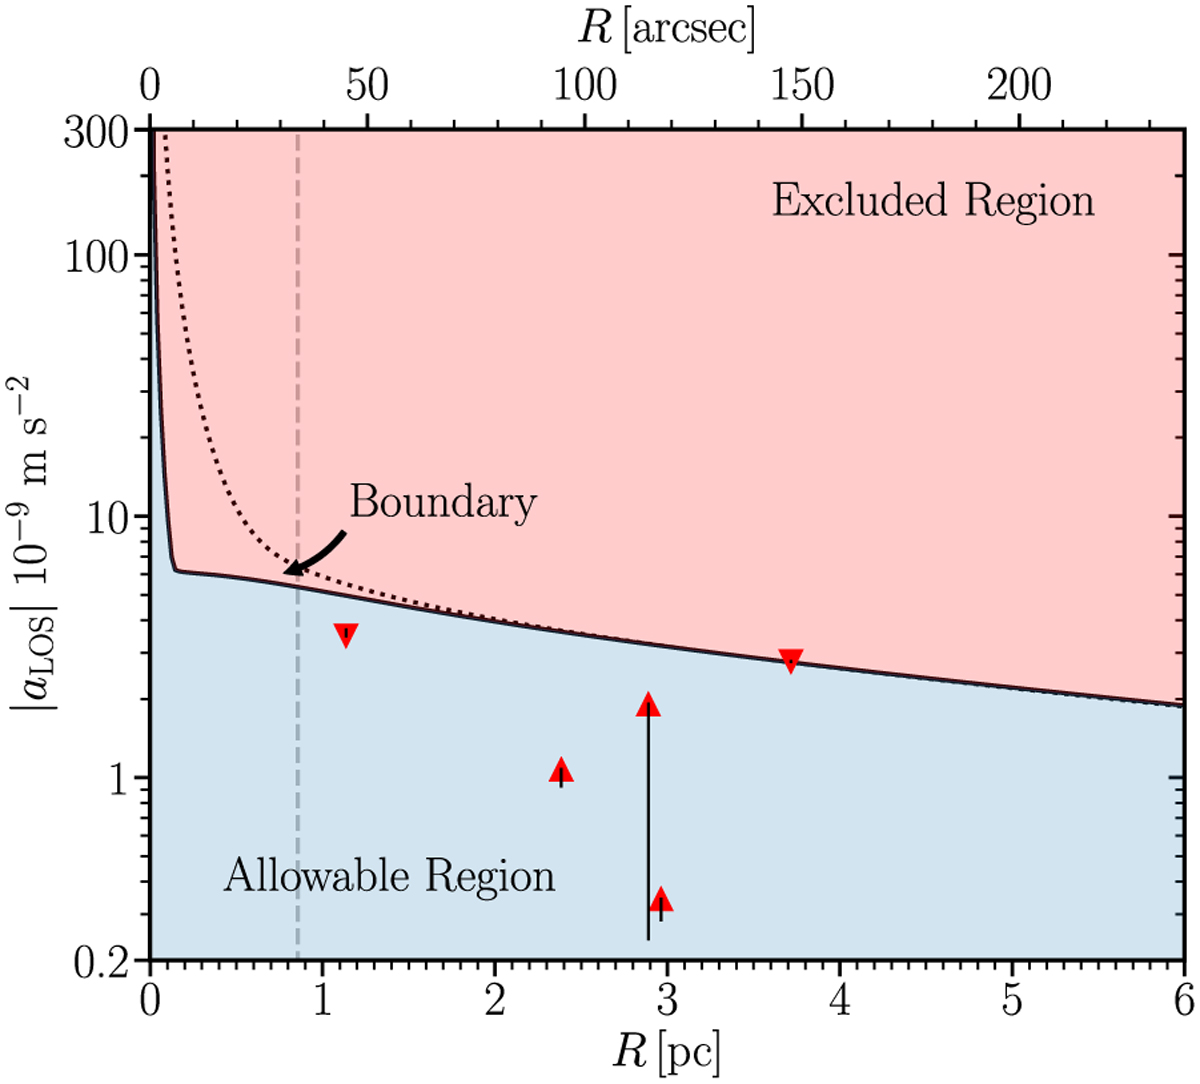
Absolute values of MSP LOS accelerations. The black solid line denotes the 95%CL upper bounds as inferred from the mass profiles of the posterior distribution. This region marks the boundary between the excluded region (red) and the allowable one (blue), where it is possible to find a value of l (i.e., a position within the cluster) compatible with the LOS acceleration at a given projected radius. The upwards (downwards) pointing triangles denote the observed MSP accelerations with positive (negative) values, as inferred from the MSP timing data. Errors are not included as they fall below the size of the data points. The vertical black lines denote the intrinsic spin-down components leading to the intrinsic LOS accelerations that trace the GC potential, based on the 68% CL regions in the magnetic field strength posteriors. This interval accounts for 84% of the posterior distribution as it includes the lower tail below the 16% percentile value in addition to the 68% CL interval contributions. The black, dotted line shows the corresponding bound for an illustrative model where ~15% of the central mass distribution is concentrated in the form of a 4 × 10⁴ M⊙ IMBH. As can be seen, this model is still consistent with the pulsar accelerations (triangles), but is in tension with the proper motion and line of sight velocity data. A lower mass IMBH is still allowed (see the central allowable region that reaches to higher accelerations). The gray, dashed line indicates the projected position of the innermost detected MSP in ω Cen at ~0.86 pc from its center.
Current usage metrics show cumulative count of Article Views (full-text article views including HTML views, PDF and ePub downloads, according to the available data) and Abstracts Views on Vision4Press platform.
Data correspond to usage on the plateform after 2015. The current usage metrics is available 48-96 hours after online publication and is updated daily on week days.
Initial download of the metrics may take a while.