Fig. 3.
Download original image
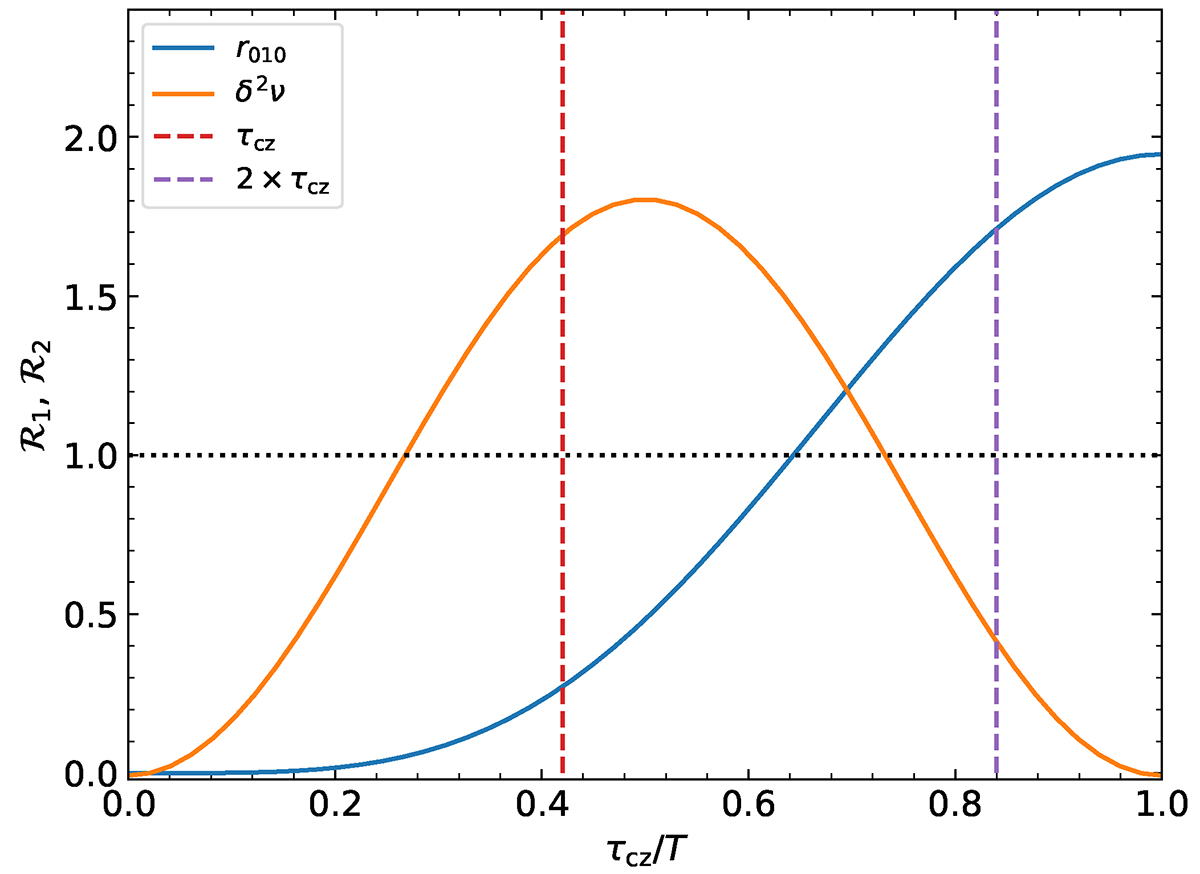
Signal-to-uncertainty ratio of the BSCZ signature (see the text for the definition) in the r010 ratios (blue curves) and the second differences (orange curves) normalised by the signal-to-uncertainty ratio observed in the frequency, according to the scaled acoustic depth of the BSCZ for KIC6679371. We note that from one star to another, this figure is very similar. The horizontal dotted line indicates where the signal-to-noise ratio of the signature of the BSCZ is equal to the signal-to-noise ratio of the frequencies. Both vertical dashed lines indicate the position of the τcz and 2 × τcz inputted in the synthetic data.
Current usage metrics show cumulative count of Article Views (full-text article views including HTML views, PDF and ePub downloads, according to the available data) and Abstracts Views on Vision4Press platform.
Data correspond to usage on the plateform after 2015. The current usage metrics is available 48-96 hours after online publication and is updated daily on week days.
Initial download of the metrics may take a while.