Fig. 2.
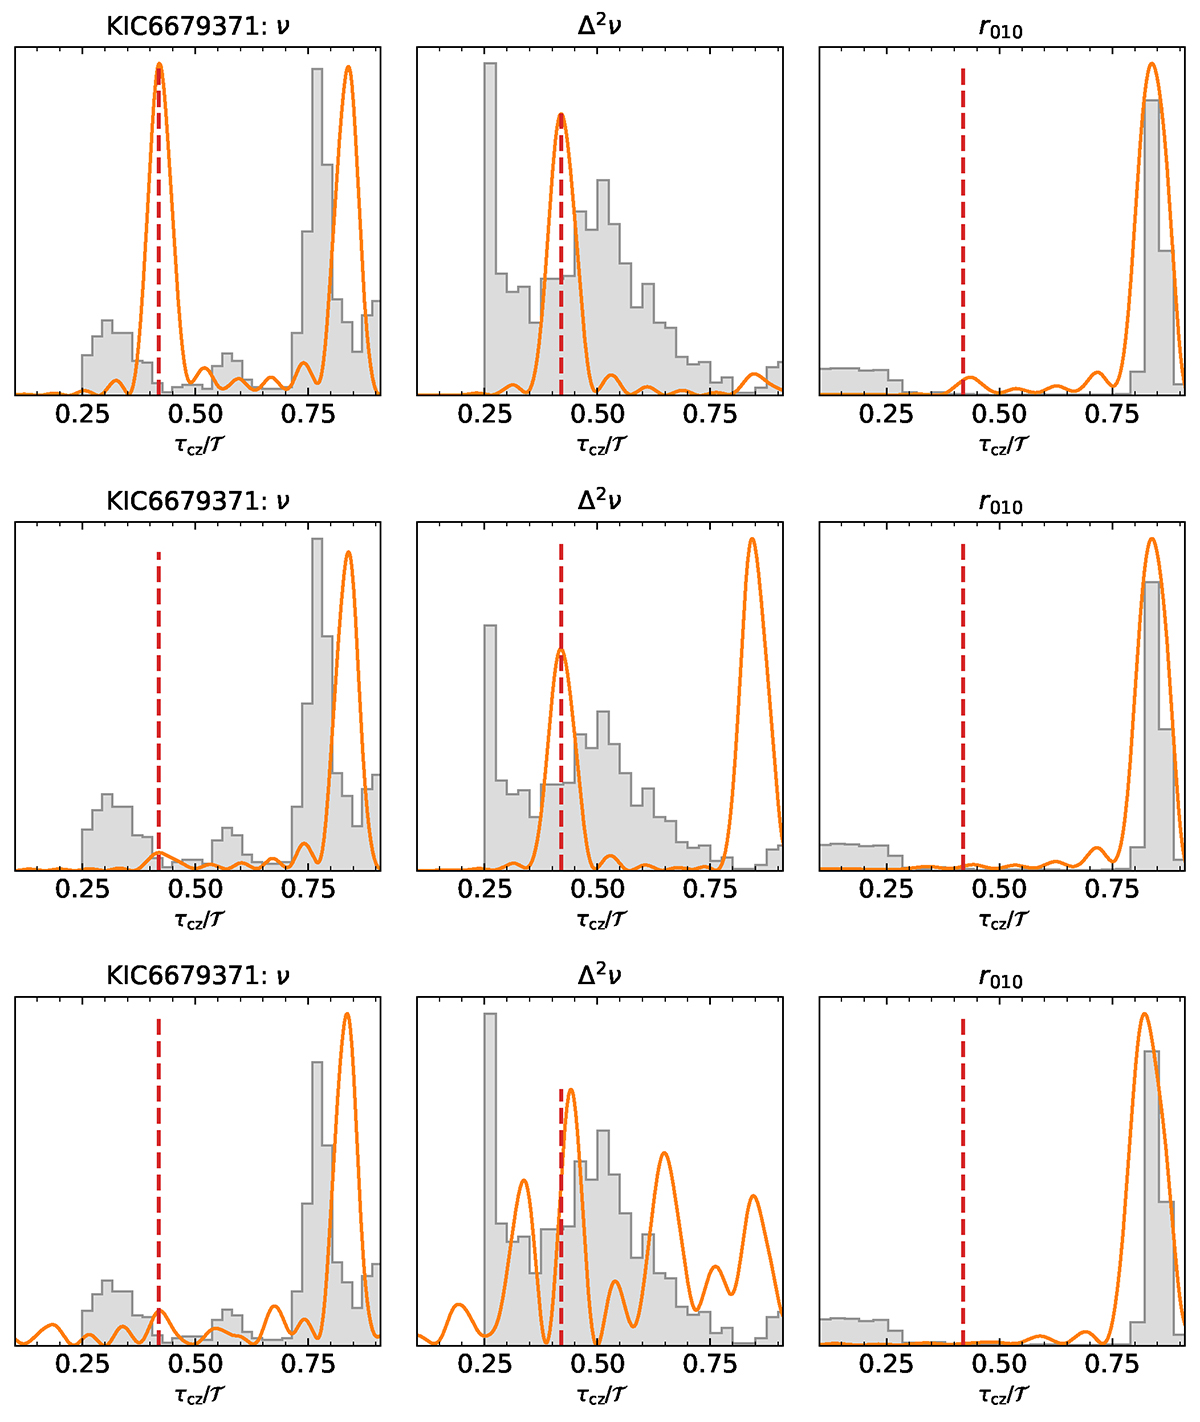
Download original image
Same as Fig. 1 except that the synthetic data include an additional term with twice the acoustic depth. The amplification factor k = 1 and 5 for the top and middle panel, respectively. For the bottom panel, k = 3 and random noise is added to the synthetic data. The red dashed vertical lines indicate the position of the BSCZ as inputted in the synthetic data. That position is selected to reproduce the peaks in the distributions obtained from the frequencies and ratios with the additional term. The amplitude of the Fourier transform is adapted for clarity, especially for the second differences presented in the bottom panel for which the amplitude of the Fourier transform is smaller than for the other panels.
Current usage metrics show cumulative count of Article Views (full-text article views including HTML views, PDF and ePub downloads, according to the available data) and Abstracts Views on Vision4Press platform.
Data correspond to usage on the plateform after 2015. The current usage metrics is available 48-96 hours after online publication and is updated daily on week days.
Initial download of the metrics may take a while.