Fig. C.1.
Download original image
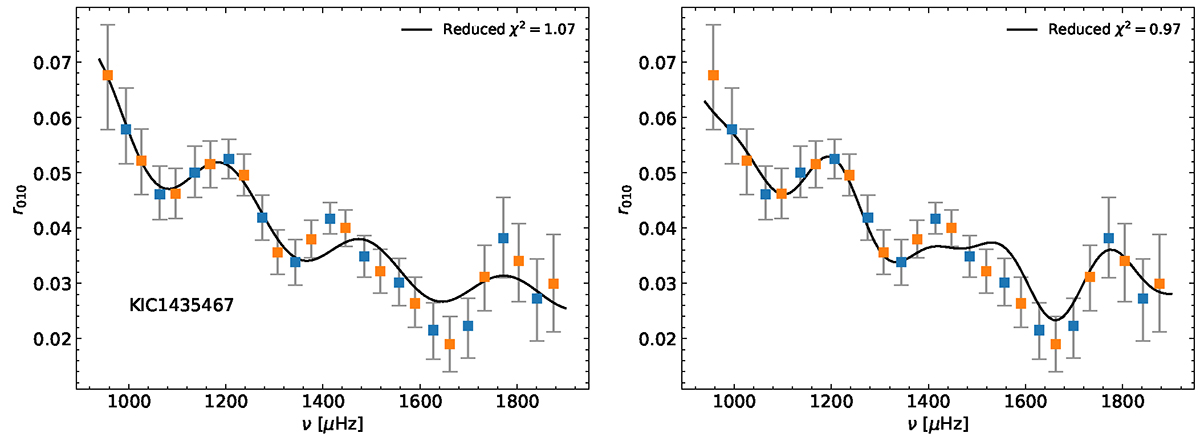
r010 ratios according to the frequency for the star KIC1435467. The left panel shows fit when the standard expression is taken into account. The right panel show the fit when the non-sinusoidal expression is used. The blue and orange symbols represent the seismic indicators for the l = 0, 1 modes, respectively. The black curves represent the fit of the seismic indicators.
Current usage metrics show cumulative count of Article Views (full-text article views including HTML views, PDF and ePub downloads, according to the available data) and Abstracts Views on Vision4Press platform.
Data correspond to usage on the plateform after 2015. The current usage metrics is available 48-96 hours after online publication and is updated daily on week days.
Initial download of the metrics may take a while.