Fig. 1.
Download original image
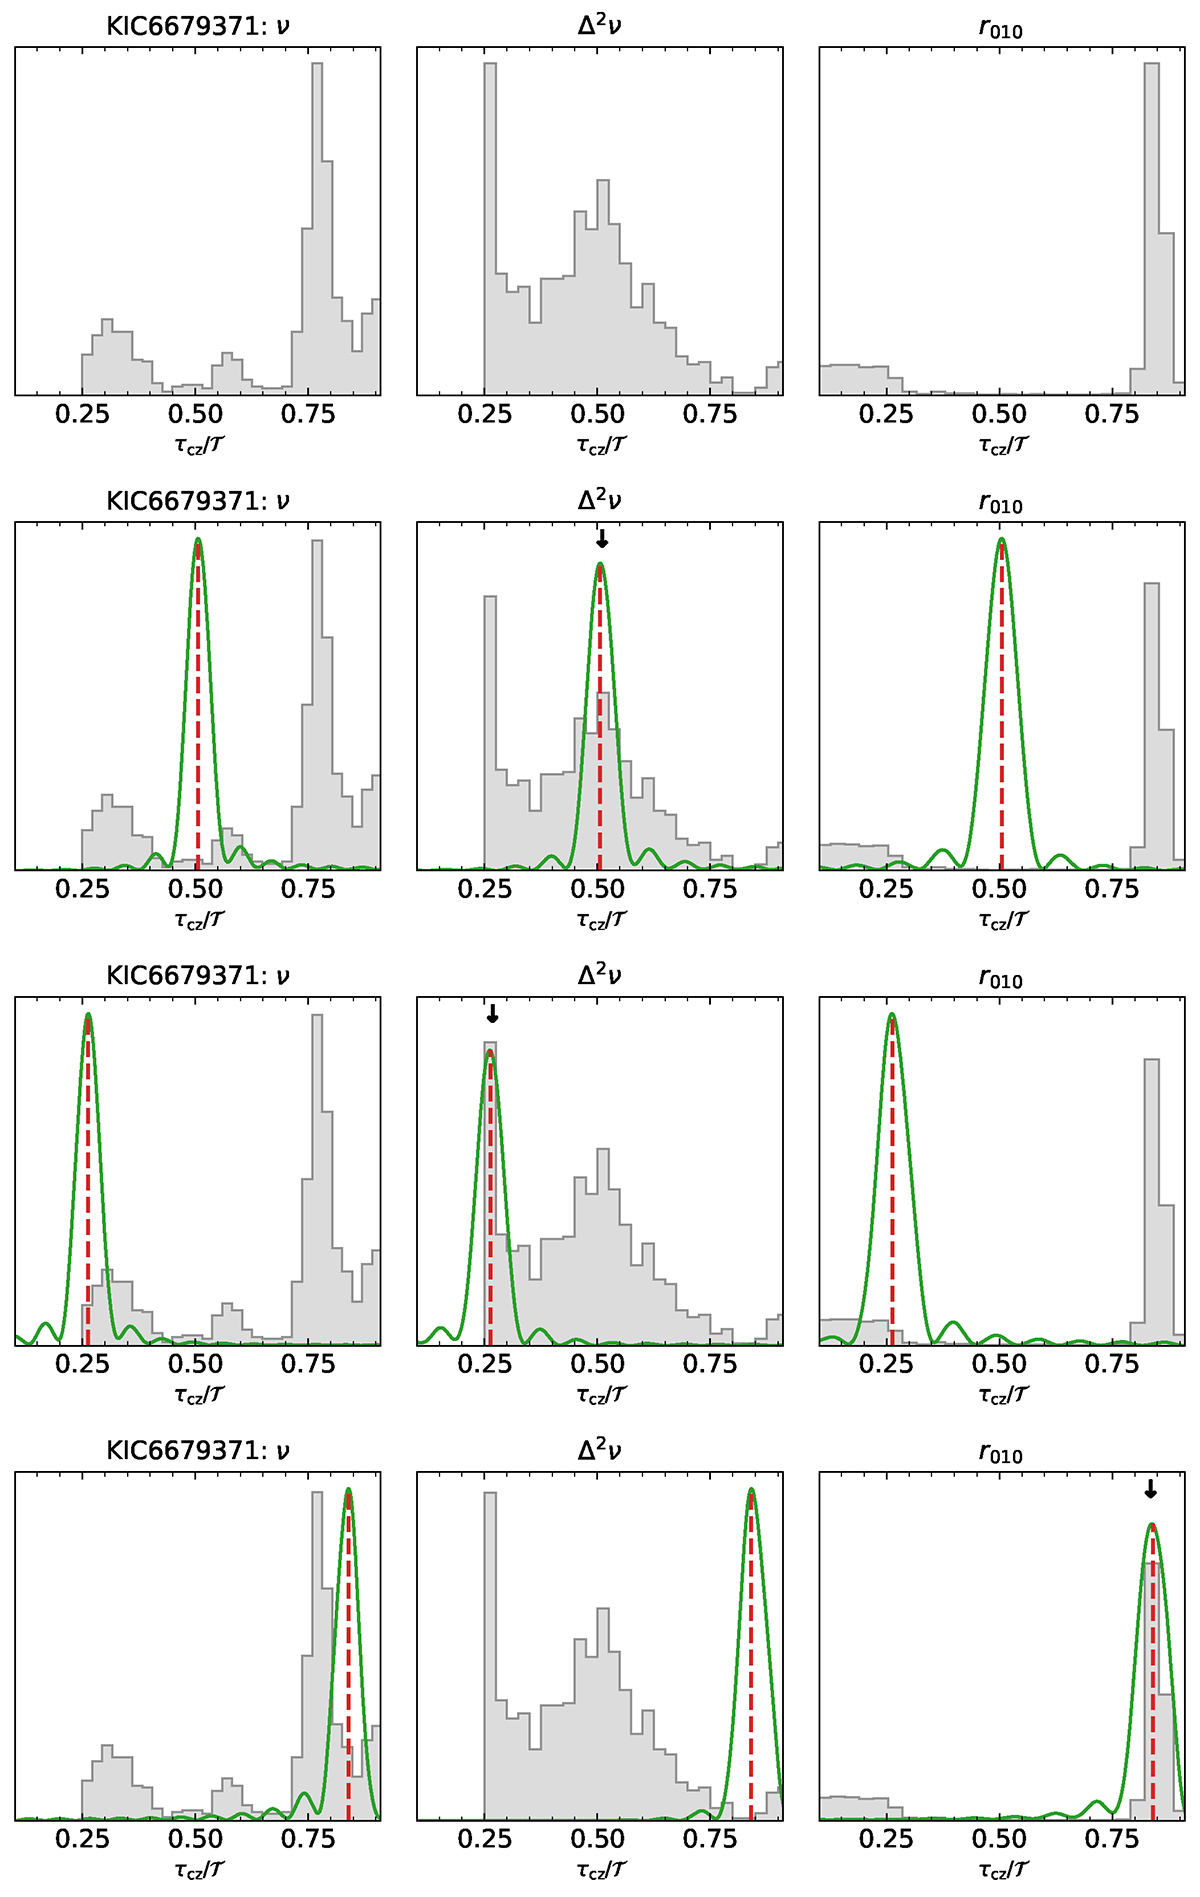
Distributions of τcz/𝒯 for the glitch signature in the frequencies (left panels), second differences (middle panels), and r010 ratios (right panels) for the Kepler star KIC6679371 (in light grey). 𝒯 = 1/(2Δν) is the total acoustic radius of the star. The results for the r010 ratios are converted from the measured tcz with τcz = 𝒯 − tcz. The light grey histograms are obtained by a fit of the observed data with the standard expressions (Eqs. 9, 10, 12). For clarity, the top panels represent the observed distributions alone. The green curve represent the resampled Fourier transform of the synthetic data. The red dashed vertical lines indicate the position of the BSCZ as inputted in the synthetic data. The black down arrows show the peak in the histogram of the observed distribution selected to generate the synthetic data.
Current usage metrics show cumulative count of Article Views (full-text article views including HTML views, PDF and ePub downloads, according to the available data) and Abstracts Views on Vision4Press platform.
Data correspond to usage on the plateform after 2015. The current usage metrics is available 48-96 hours after online publication and is updated daily on week days.
Initial download of the metrics may take a while.