Fig. 5.

Download original image
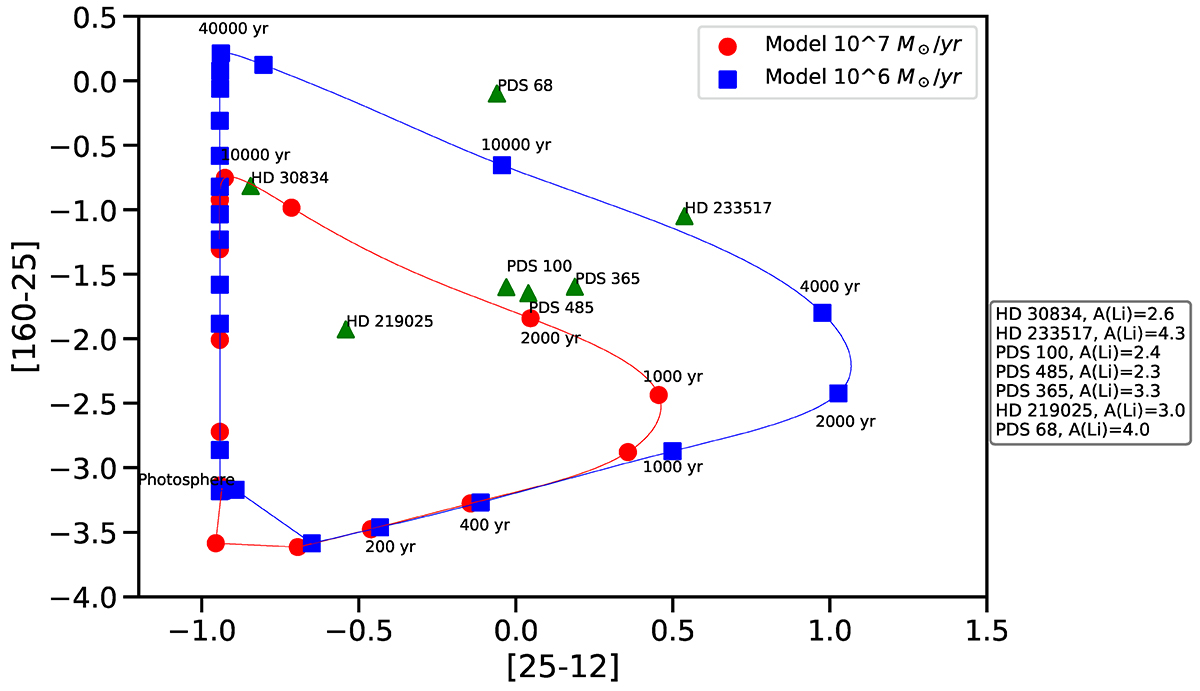
Model of stellar shell ejections represented here in a colour-colour diagram with wavelengths at 12 μm, 25 μm, and 160 μm, with two loops indicating the growing in time of the shells (see text). The red trajectory is for stellar mass losses of 10−7 M⊙/yr and the blue is for 10−6 M⊙/yr. Green filled triangles indicate observed colours of some giant stars together with their respective Li abundances. Both axes are represented by [λ1 – λ2] = log (λ2F1) – log (λ1F2). The observed fluxes (F)in Jy were obtained from Rebull et al. (2015) and AKARI and HERSCHEL catalogues.
Current usage metrics show cumulative count of Article Views (full-text article views including HTML views, PDF and ePub downloads, according to the available data) and Abstracts Views on Vision4Press platform.
Data correspond to usage on the plateform after 2015. The current usage metrics is available 48-96 hours after online publication and is updated daily on week days.
Initial download of the metrics may take a while.


