Fig. 2.
Download original image
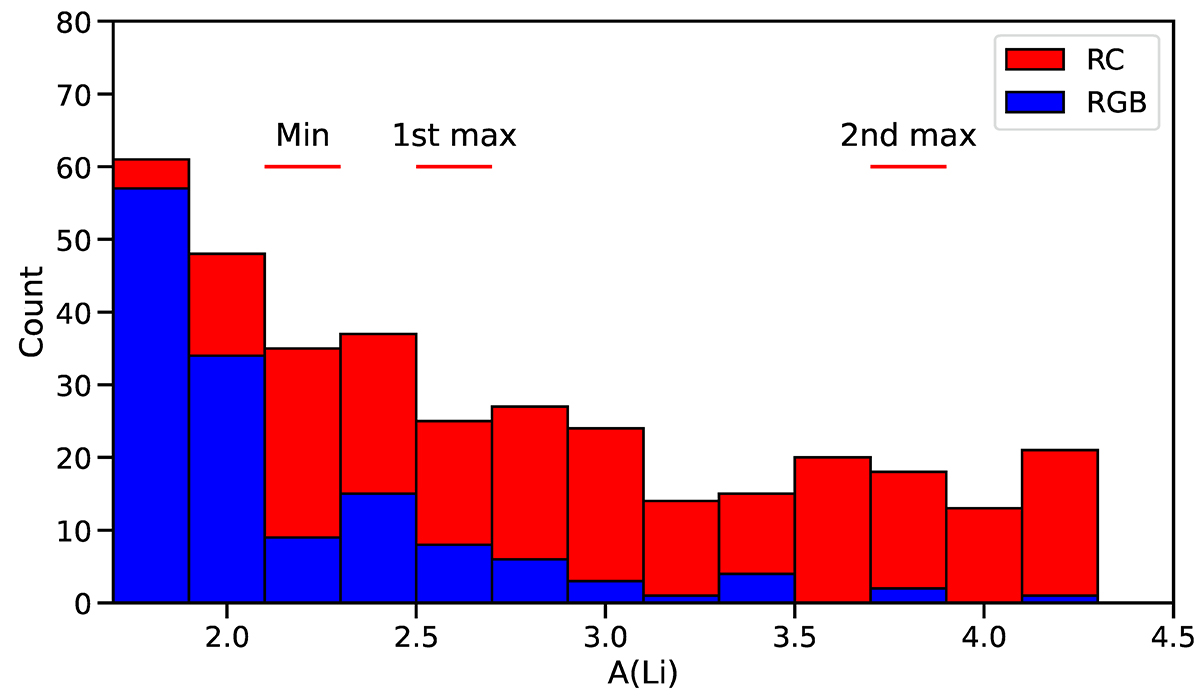
Counts of giant RC and RGB stars with IR excesses as function of Li abundance in dex as obtained in this work. This figure must be compared with a similar figure of YA21 based on asteroseismology data (Figure 1 in YA21). Using short horizontal lines, we present the regions coincident with the presence of minimums and maximums of the figure of YA21. In our work, we eliminated all bright RC giants stars with log-g values under 2.2 for which no astroseismology calibration exists following YA21.
Current usage metrics show cumulative count of Article Views (full-text article views including HTML views, PDF and ePub downloads, according to the available data) and Abstracts Views on Vision4Press platform.
Data correspond to usage on the plateform after 2015. The current usage metrics is available 48-96 hours after online publication and is updated daily on week days.
Initial download of the metrics may take a while.