Fig. 1.
Download original image
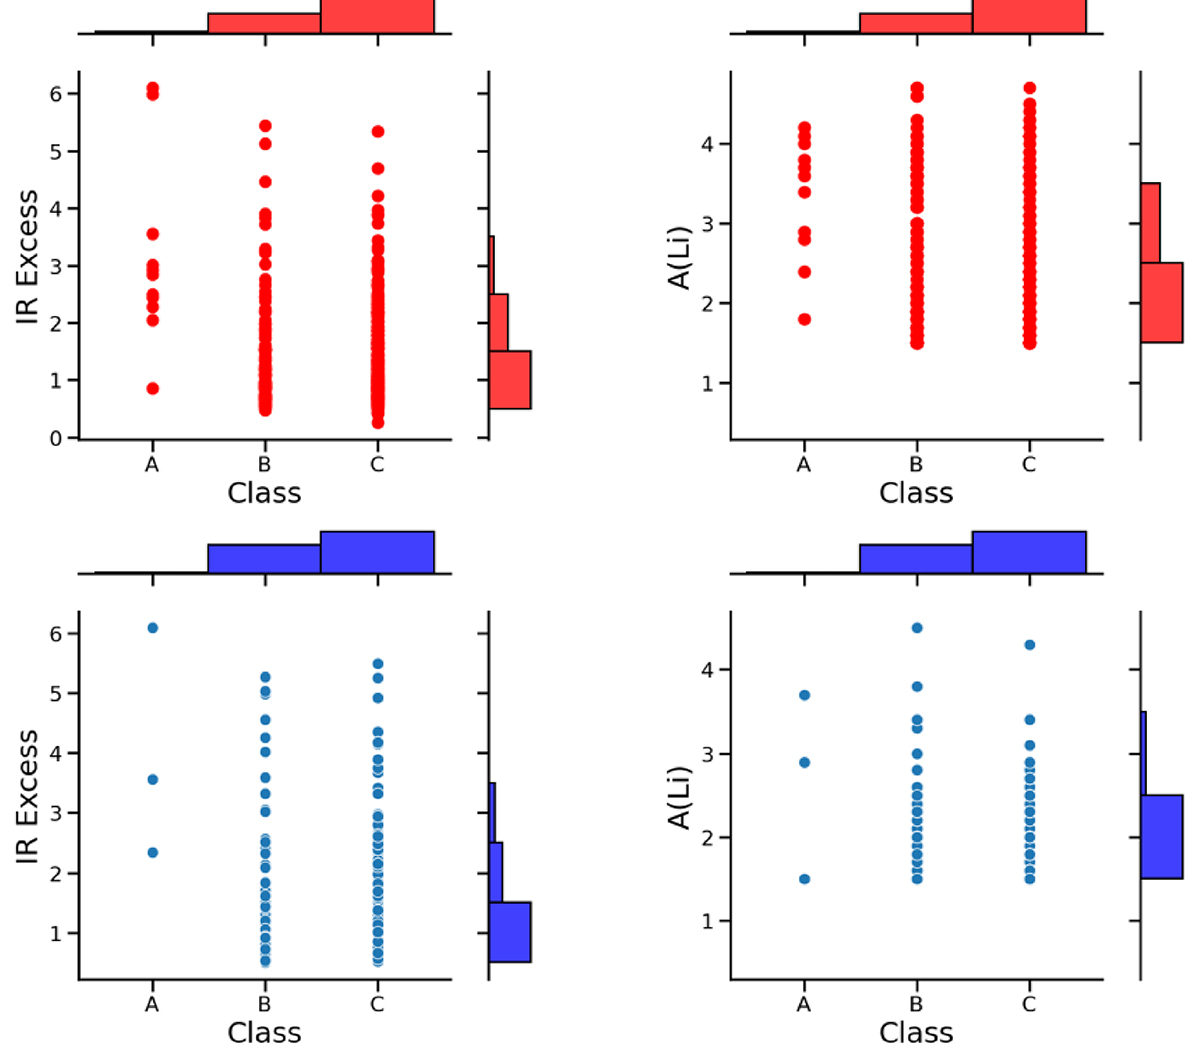
Distribution of RC and RGB giant stars in different classes of signal-to-noise ratios A, B, and C for the IR excess measured by the difference of WISE bands W1–W4 in magnitudes related flux densities expressed in Janskys (Jy) (first column) and for the Li abundance in dex (second column). Histograms of these distributions are presented in the right vertical and horizontal scales.
Current usage metrics show cumulative count of Article Views (full-text article views including HTML views, PDF and ePub downloads, according to the available data) and Abstracts Views on Vision4Press platform.
Data correspond to usage on the plateform after 2015. The current usage metrics is available 48-96 hours after online publication and is updated daily on week days.
Initial download of the metrics may take a while.