Fig. 9.
Download original image
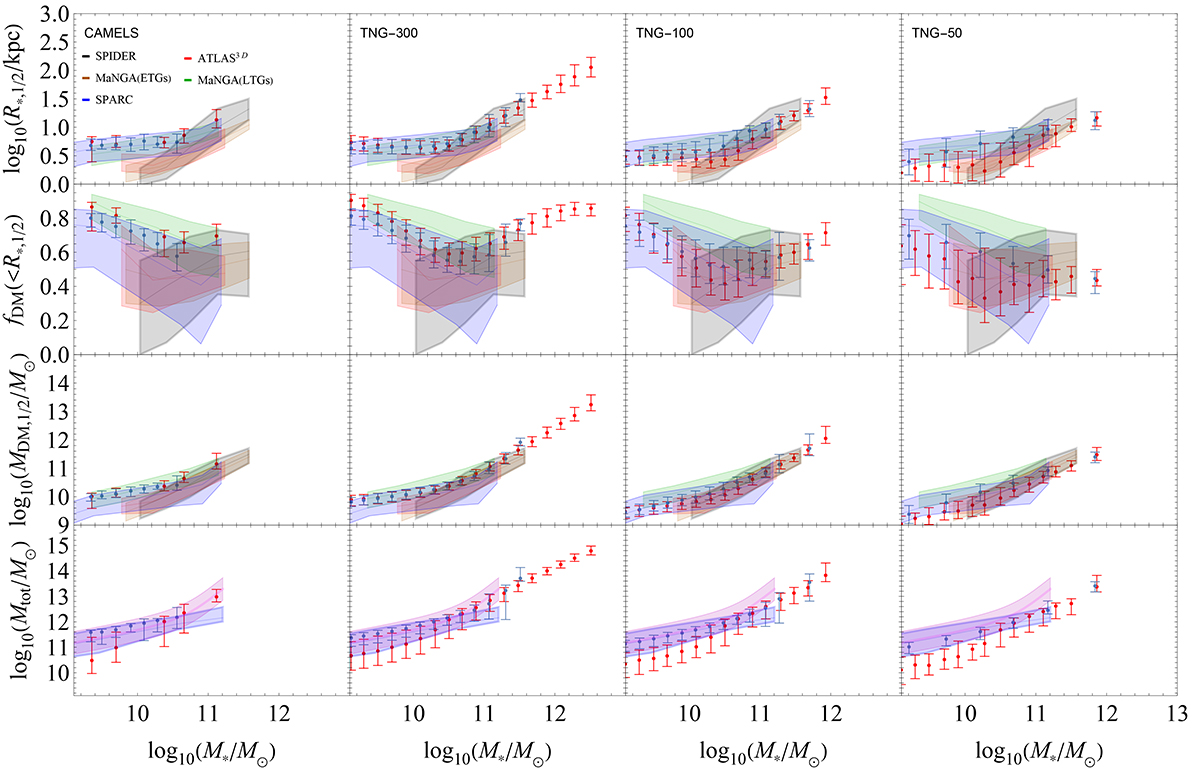
Comparison of different IllustrisTNG suites with observational trends. From top to bottom: stellar half-mass radius, DM fraction within the stellar half-mass radius and DM mass within the stellar half-mass radius as a function of stellar mass, for fiducial CAMELS simulation (first column), TNG-300 (second column), TNG-100 (third column) and TNG-50 (fourth column). The simulated galaxies for all four simulations have been binned in bins of stellar mass (red points for ETGs, blue points for LTGs, uncertainty given by the standard deviation of the y-values in the bins). The coloured regions have the same meaning as in Figs. 1 and 7.
Current usage metrics show cumulative count of Article Views (full-text article views including HTML views, PDF and ePub downloads, according to the available data) and Abstracts Views on Vision4Press platform.
Data correspond to usage on the plateform after 2015. The current usage metrics is available 48-96 hours after online publication and is updated daily on week days.
Initial download of the metrics may take a while.