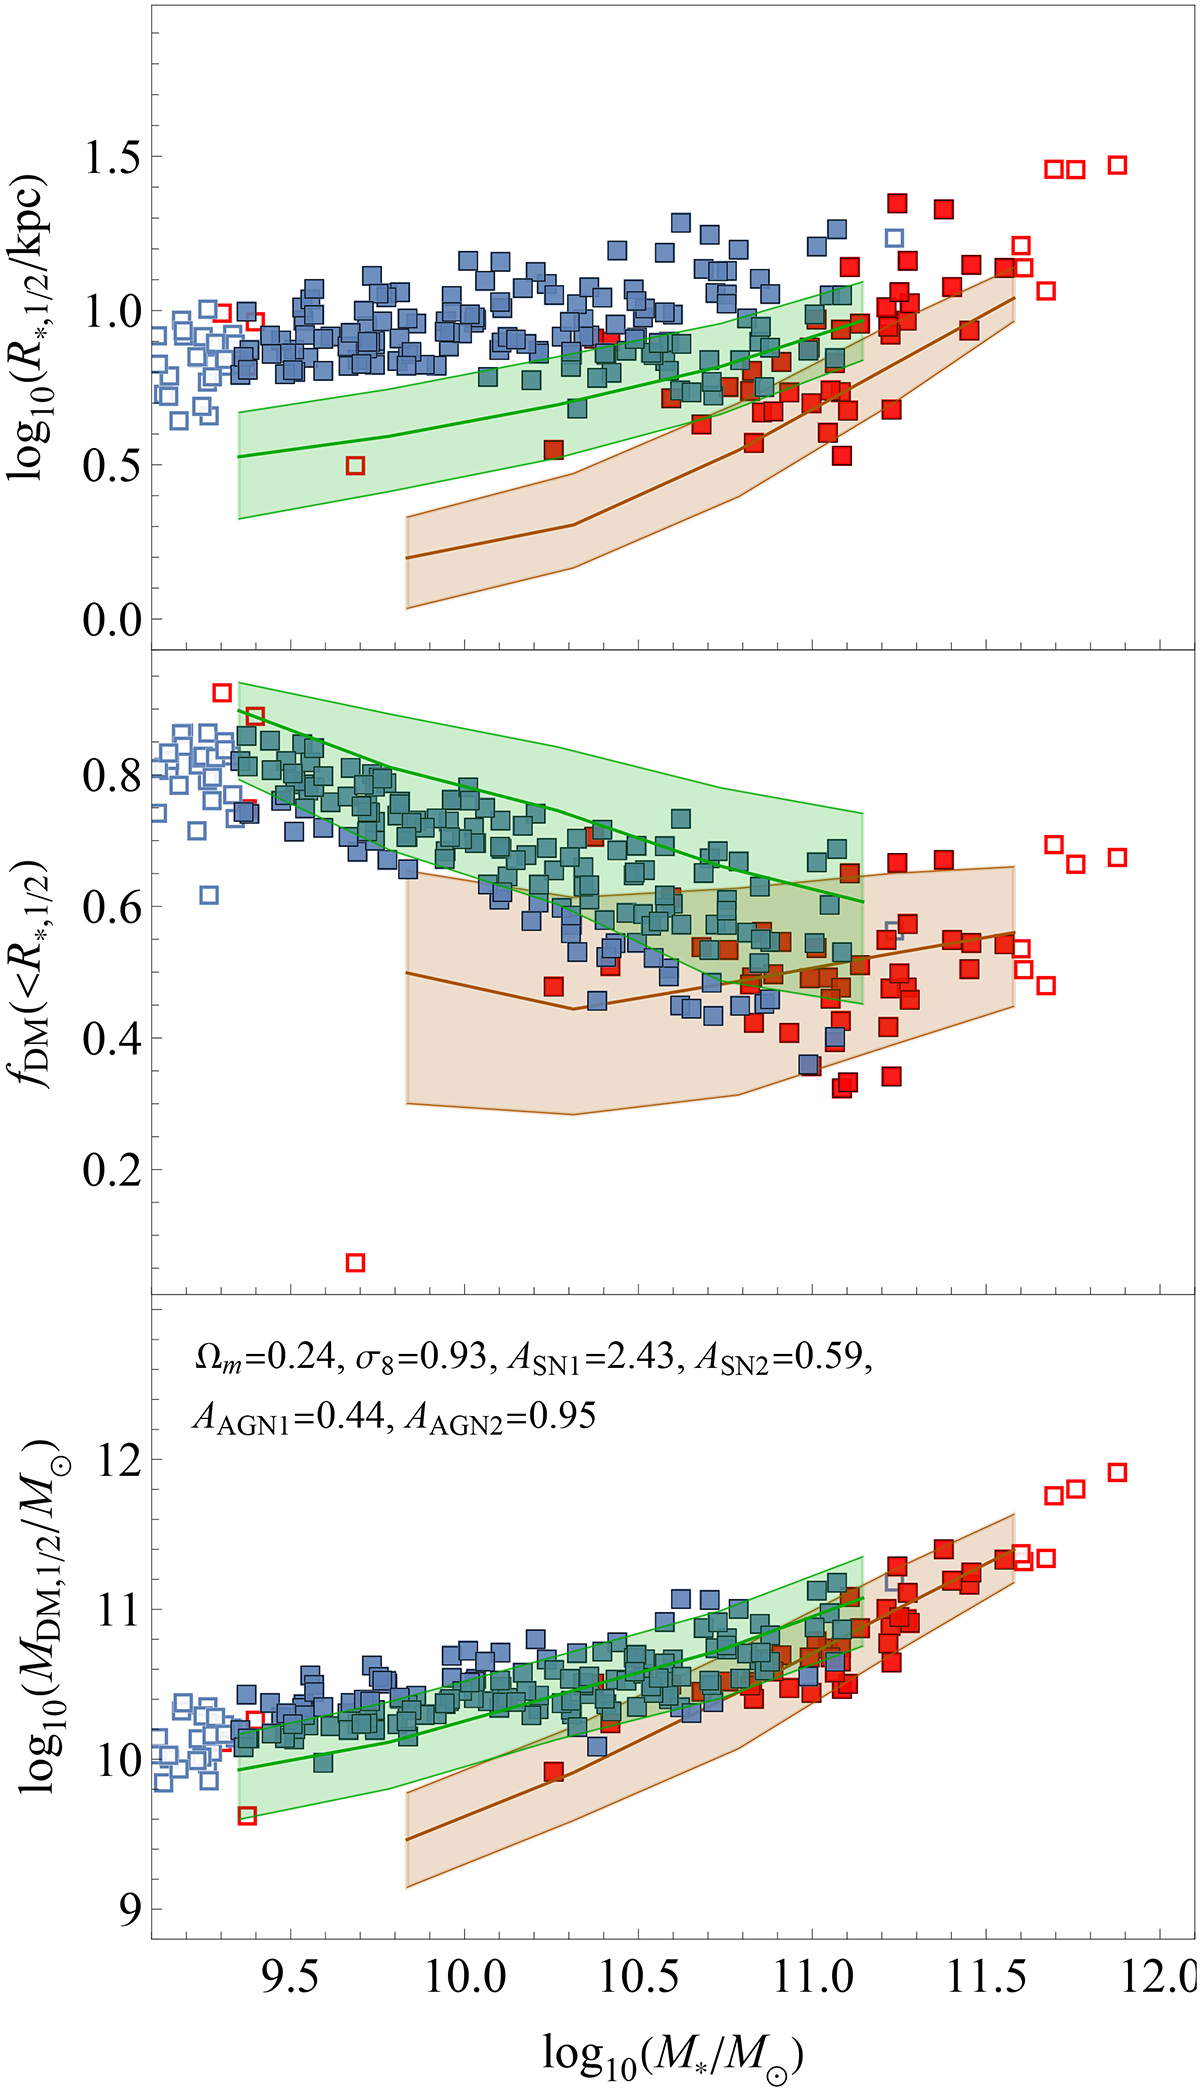
Fig. 8.
Download original image
Same as Fig. 4, but for the best-fit simulation to the whole MaNGA DynPop sample, LH_531. The blue squares indicate simulated LTG galaxies, while red squares indicate simulated ETG galaxies. The open squares are galaxies not used for the evaluation of the cumulative reduced chi-squared associated to the respective observational trend. The dark orange region is associated to the observed MaNGA DynPop ETG sample, while the green region is associated to the LTG sample.
Current usage metrics show cumulative count of Article Views (full-text article views including HTML views, PDF and ePub downloads, according to the available data) and Abstracts Views on Vision4Press platform.
Data correspond to usage on the plateform after 2015. The current usage metrics is available 48-96 hours after online publication and is updated daily on week days.
Initial download of the metrics may take a while.