Fig. 6.
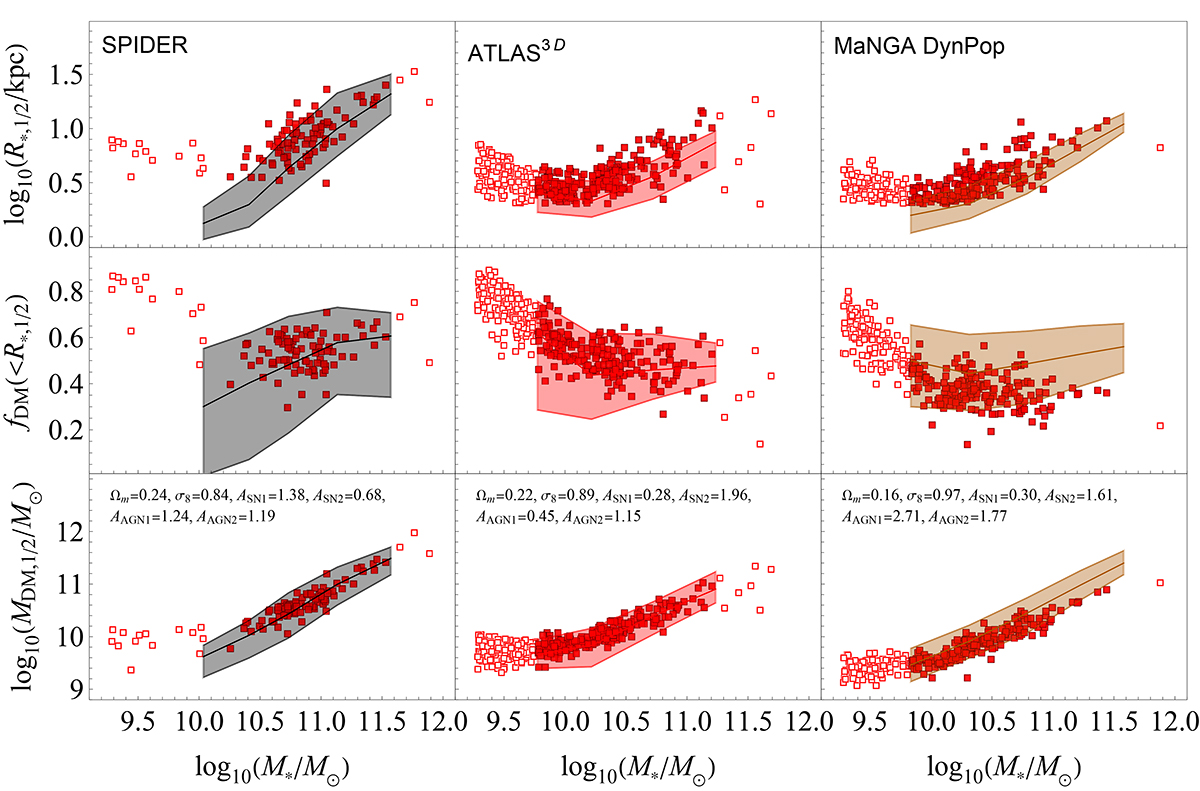
Download original image
Each column of this figure is the same as in Fig. 4, but for the best-fit simulation associated to SPIDER (left column), ATLAS3D (center column) and MaNGA DynPop (right column) observational trends. Red squares are the simulated galaxies. Filled red squares are for galaxies used for the evaluation of the cumulative reduced chi-squared with respect to the associated observational trend.
Current usage metrics show cumulative count of Article Views (full-text article views including HTML views, PDF and ePub downloads, according to the available data) and Abstracts Views on Vision4Press platform.
Data correspond to usage on the plateform after 2015. The current usage metrics is available 48-96 hours after online publication and is updated daily on week days.
Initial download of the metrics may take a while.