Fig. 4.
Download original image
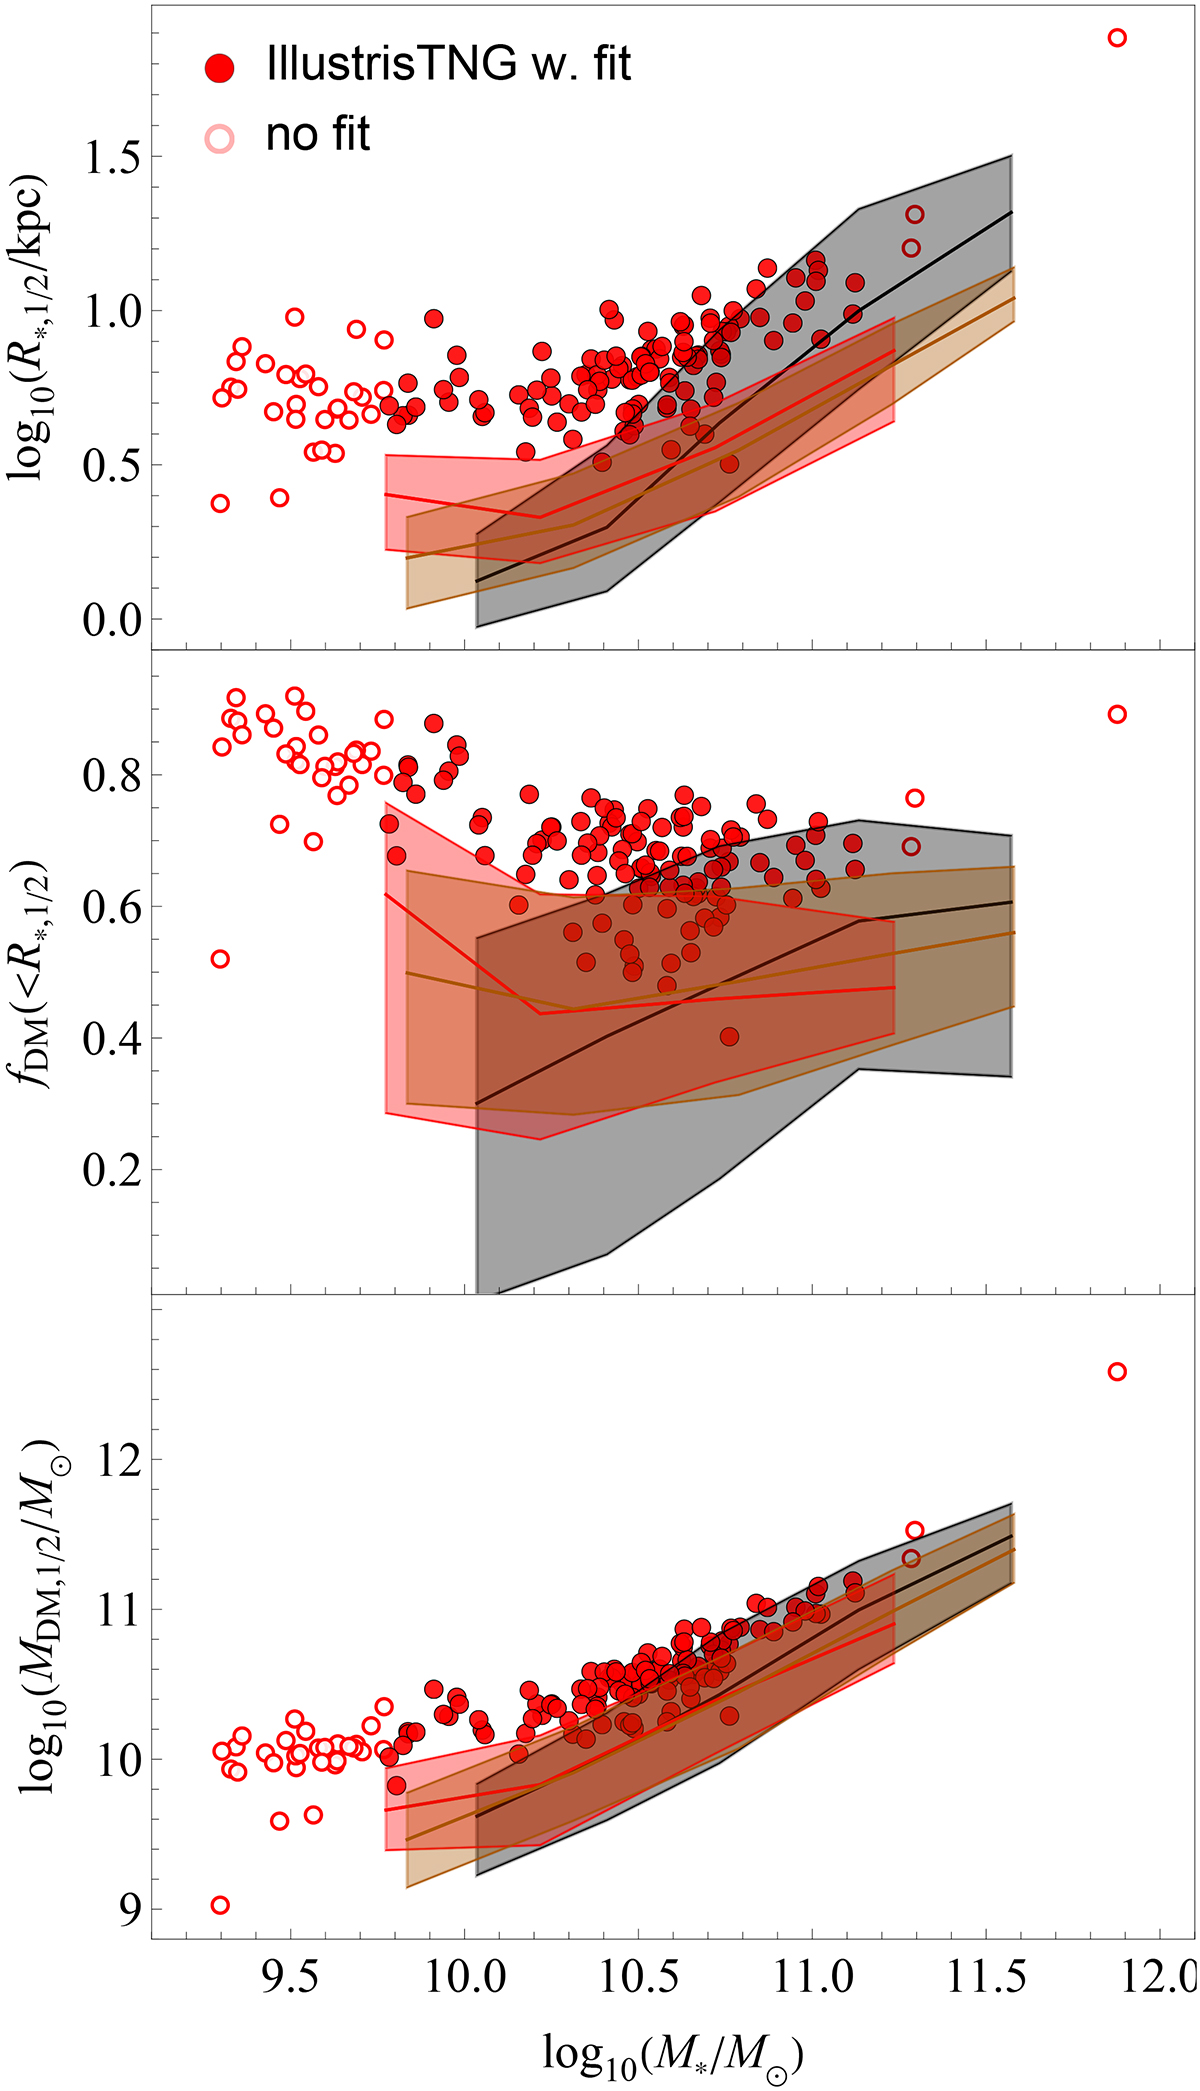
Comparison of fiducial IllustrisTNG simulation with observational trends. From top to bottom: stellar half-mass radius, R*, 1/2, DM fraction within R*, 1/2, fDM, and DM mass within R*, 1/2, MDM, 1/2, as a function of stellar mass, M*, for the fiducial IllustrisTNG simulation 1P_1_0, compared with the corresponding SPIDER (black curves), ATLAS3D (dark red curves) and MaNGA DynPop (orange curves) trends. The shaded areas represent the scatter of the observed relations, given by the difference between the 16th and the 84th percentiles with the median. As an example, the open circles are galaxies not used for the evaluation of the cumulative reduced chi-squared associated to the ATLAS3D observational trend in Section 4.2.
Current usage metrics show cumulative count of Article Views (full-text article views including HTML views, PDF and ePub downloads, according to the available data) and Abstracts Views on Vision4Press platform.
Data correspond to usage on the plateform after 2015. The current usage metrics is available 48-96 hours after online publication and is updated daily on week days.
Initial download of the metrics may take a while.