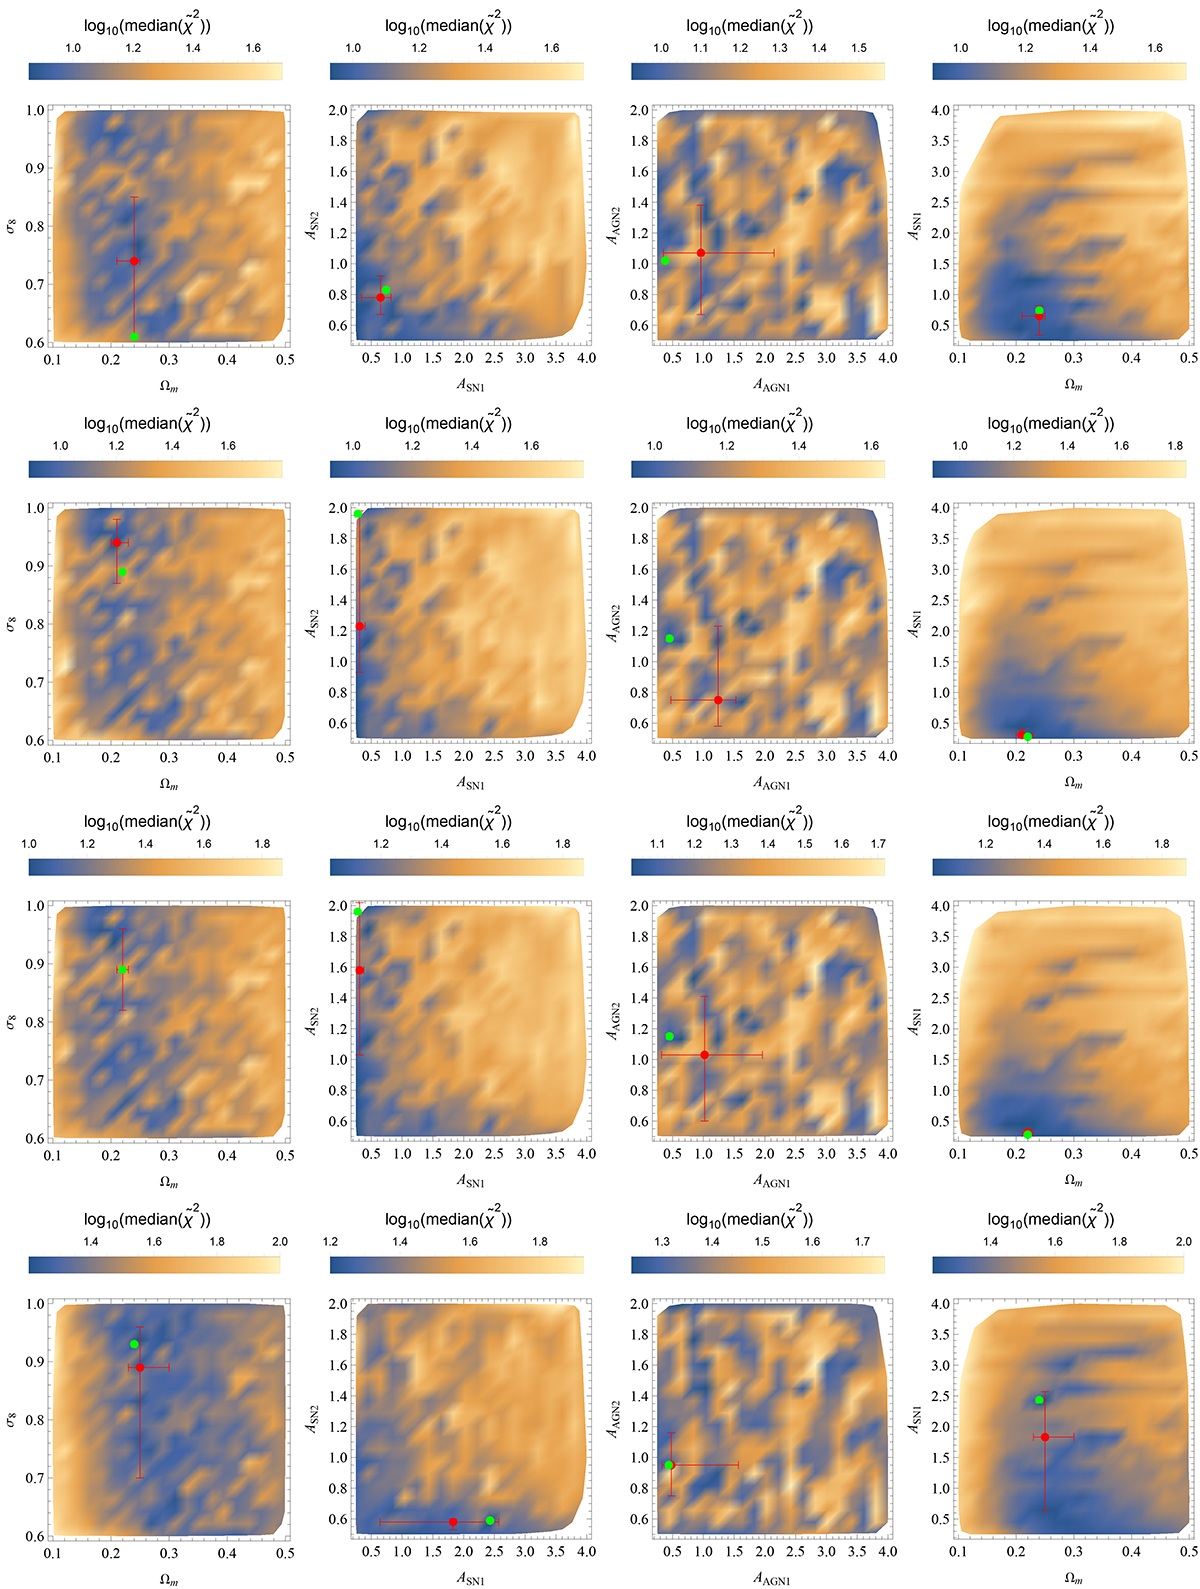
Fig. C.1.
Download original image
Heat maps showing regions of the parameter space as a function of the value of cumulative reduced chi-squared for each simulation. The colours show the logarithm of the median of the 100 values of ![]() associated to each resampling obtained by the bootstrap procedure. The rows, from top to bottom, show the heat maps for the fits with SPARC+SPIDER, SPARC+ATLAS3D, SPARC+MaNGA DynPop, and LTGs+ETGs from MaNGA DynPop. The red point shows the values of Table 5, while the green points are the values from the respective best-fit simulations.
associated to each resampling obtained by the bootstrap procedure. The rows, from top to bottom, show the heat maps for the fits with SPARC+SPIDER, SPARC+ATLAS3D, SPARC+MaNGA DynPop, and LTGs+ETGs from MaNGA DynPop. The red point shows the values of Table 5, while the green points are the values from the respective best-fit simulations.
Current usage metrics show cumulative count of Article Views (full-text article views including HTML views, PDF and ePub downloads, according to the available data) and Abstracts Views on Vision4Press platform.
Data correspond to usage on the plateform after 2015. The current usage metrics is available 48-96 hours after online publication and is updated daily on week days.
Initial download of the metrics may take a while.