Fig. 1.
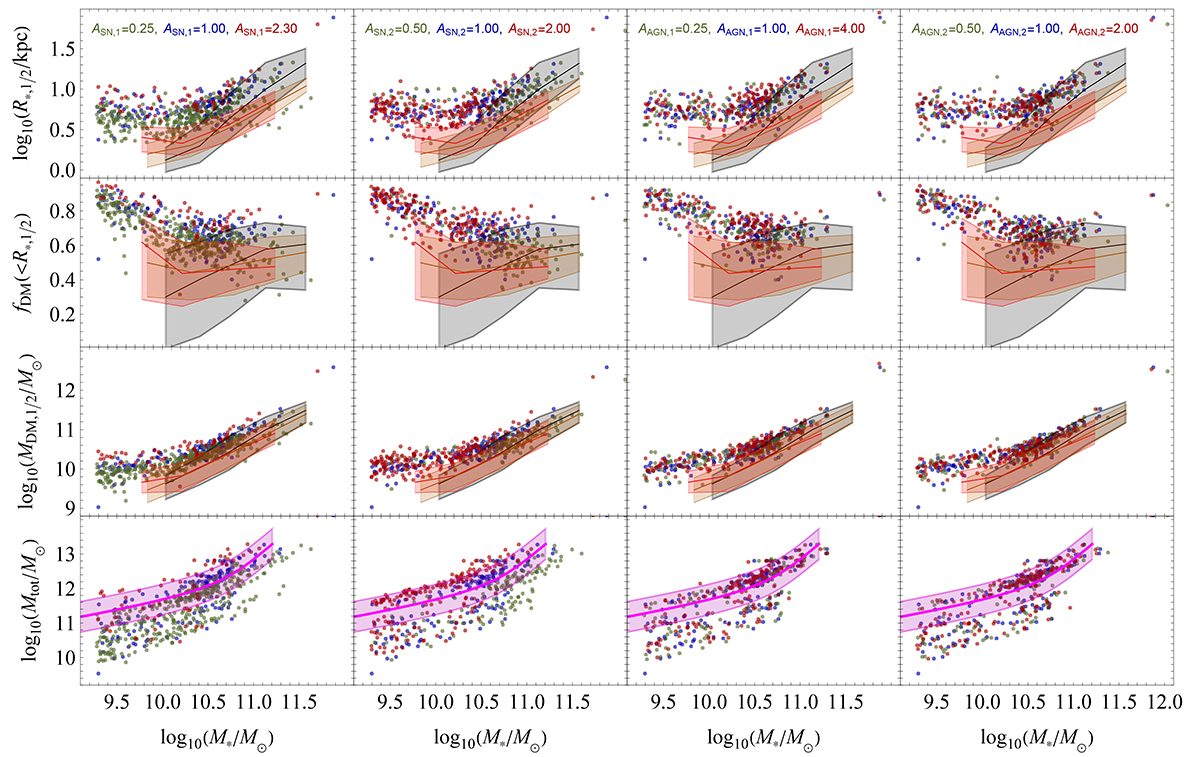
Download original image
Comparison between SPIDER (grey region), ATLAS3D (red region), MaNGA DynPop (orange region) and the theoretical Mtot–M* relation from Moster et al. (2013) (pink region) with IllustrisTNG simulations having differing astrophysical feedback parameters. Each row in the plot corresponds to a different scaling relation, from top to bottom: stellar half-mass radius, R*, 1/2, DM fraction within R*, 1/2, fDM(< R*, 1/2), DM mass within R*, 1/2, MDM, 1/2, and total (virial) mass, Mtot, as a function of stellar mass, M*. Each column shows the effect of varying one of the four astrophysical parameters. The continuous coloured lines associated to the coloured regions represent the 16th, 50th (median) and 84th percentile of the respective observational dataset distributions. The scatter of the Moster et al. (2013) theoretical relation is taken to be the mean of the scatter of the Mtot-M* relation from Posti et al. (2019).
Current usage metrics show cumulative count of Article Views (full-text article views including HTML views, PDF and ePub downloads, according to the available data) and Abstracts Views on Vision4Press platform.
Data correspond to usage on the plateform after 2015. The current usage metrics is available 48-96 hours after online publication and is updated daily on week days.
Initial download of the metrics may take a while.