Open Access
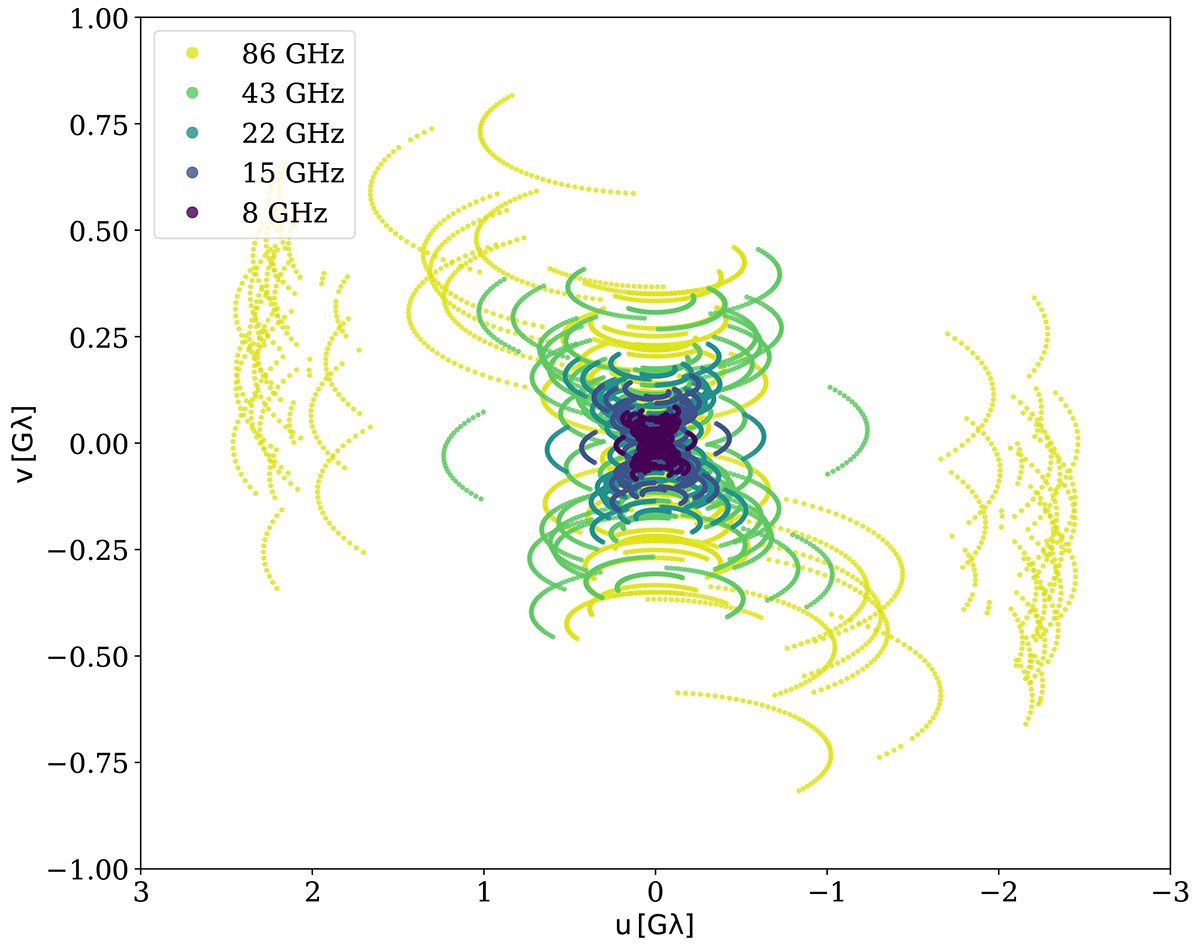
Fig. 7.
Download original image
u − v coverage of a synthetic observation on October 9, 2003, at different frequencies. Note the different baselines for 86 GHz, due to the additional GMVA stations as well as the VLBA stations not operational at 86 GHz. Notice the different x and y scales.
Current usage metrics show cumulative count of Article Views (full-text article views including HTML views, PDF and ePub downloads, according to the available data) and Abstracts Views on Vision4Press platform.
Data correspond to usage on the plateform after 2015. The current usage metrics is available 48-96 hours after online publication and is updated daily on week days.
Initial download of the metrics may take a while.