Open Access
Fig. 5.
Download original image
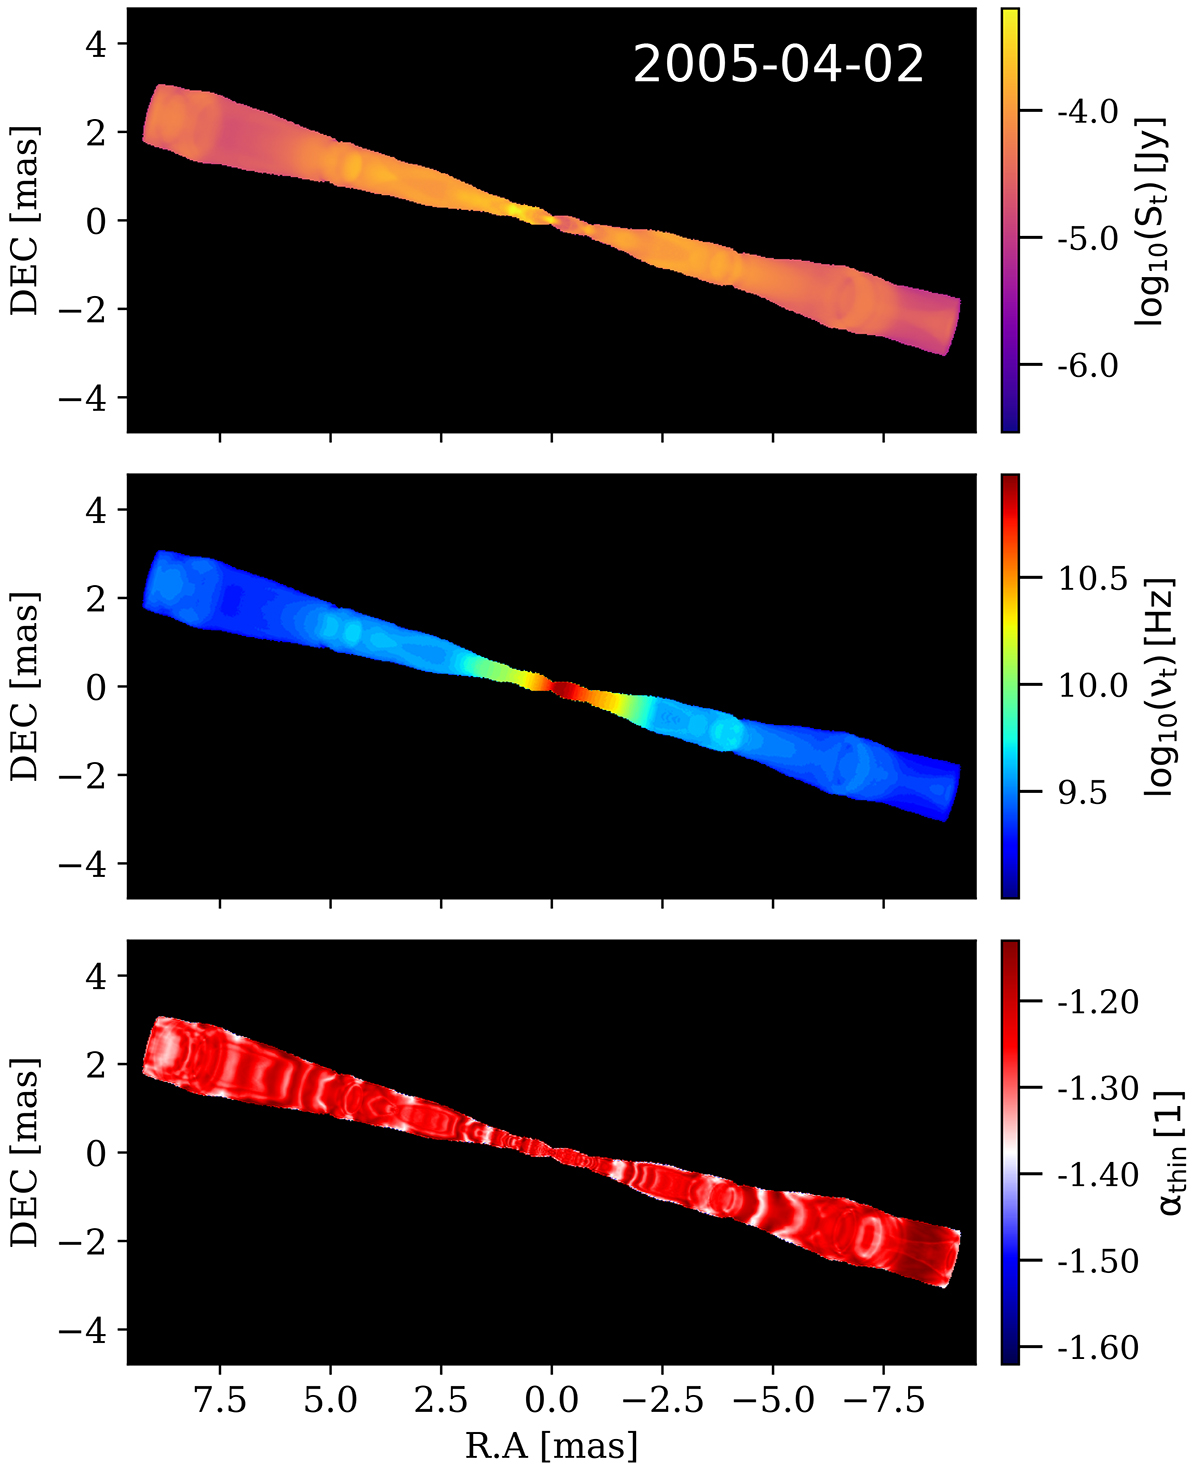
Spatial evolution of the spectral turnover position for a selected time frame. The panels show, from top to bottom, the turnover flux density, St, the turnover frequency, νt, and the optically thin spectral index, αthin.
Current usage metrics show cumulative count of Article Views (full-text article views including HTML views, PDF and ePub downloads, according to the available data) and Abstracts Views on Vision4Press platform.
Data correspond to usage on the plateform after 2015. The current usage metrics is available 48-96 hours after online publication and is updated daily on week days.
Initial download of the metrics may take a while.