Fig. A.4.
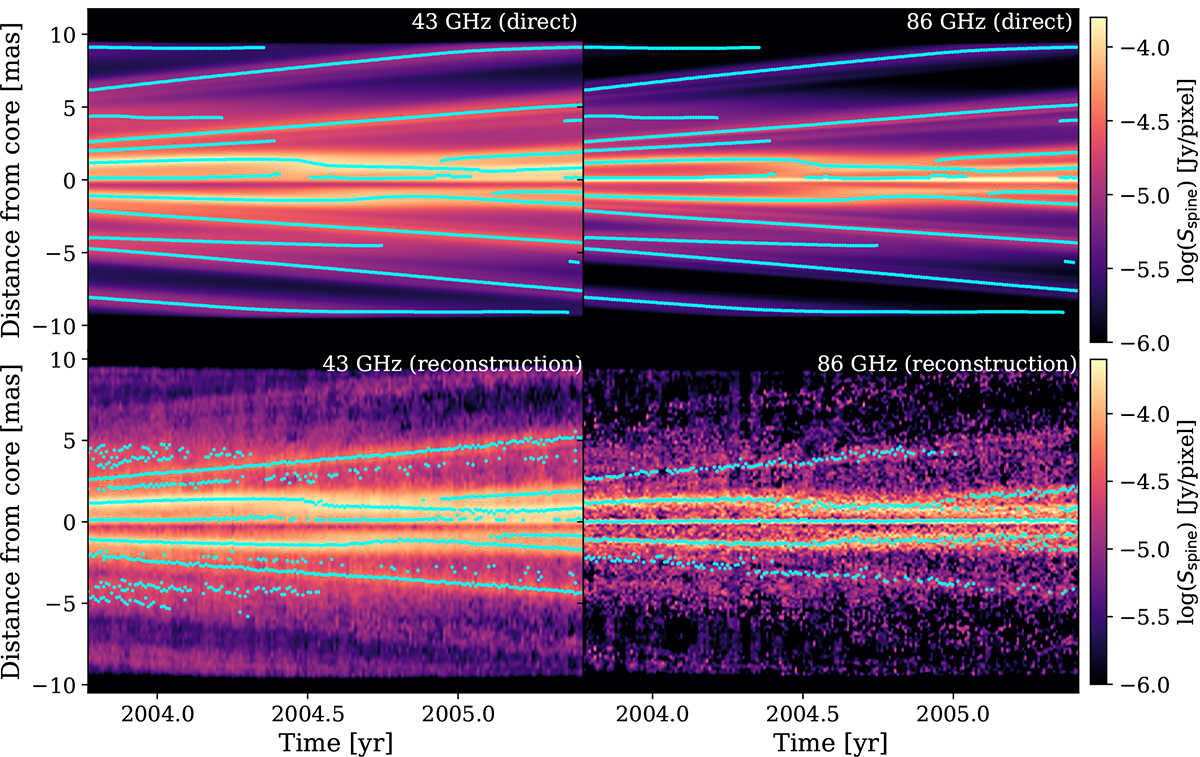
Download original image
Evolution over time of the flux of the jet spine. Each vertical slice shows the flux of the jet spine for a given time step, following the positional angle of 15°, showing the evolution of the jets’ shock structure over time. The direct emission maps (top) have been convolved with the same beam as the corresponding reconstructed maps (bottom). Overplotted in cyan are the components detected by separately applying our tracking algorithm to each of the maps. Note the effect of adjacent shocks in the tracking algorithm, such as the oscillation of the recollimation shocks when a moving shock passes through, or the jet core temporarily going undetected in the direct maps when the recollimation shock at ∼1 mas is dragged outward and expands. Note also the faint trailing components visible in the direct images. The direct emission maps also show the purely numerical effect of the moving shocks “slowing down" as they reach the end of the simulated box.
Current usage metrics show cumulative count of Article Views (full-text article views including HTML views, PDF and ePub downloads, according to the available data) and Abstracts Views on Vision4Press platform.
Data correspond to usage on the plateform after 2015. The current usage metrics is available 48-96 hours after online publication and is updated daily on week days.
Initial download of the metrics may take a while.