Open Access
Fig. 2.
Download original image
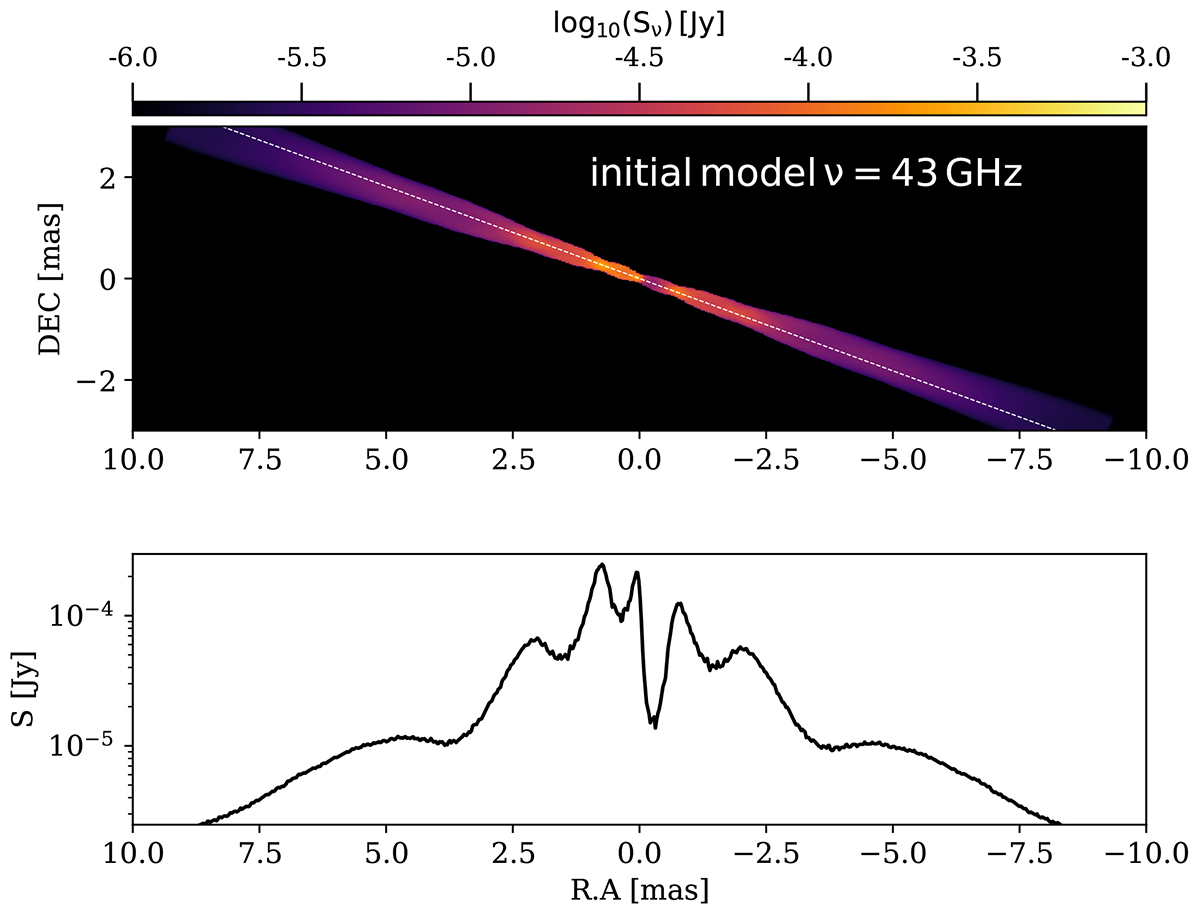
Emission from the initial steady-state jet at 43 GHz. The top panel displays the jet structure and the bottom panel the evolution of the flux density along the jet axis (dashed white line).
Current usage metrics show cumulative count of Article Views (full-text article views including HTML views, PDF and ePub downloads, according to the available data) and Abstracts Views on Vision4Press platform.
Data correspond to usage on the plateform after 2015. The current usage metrics is available 48-96 hours after online publication and is updated daily on week days.
Initial download of the metrics may take a while.