Open Access
Fig. 11.
Download original image
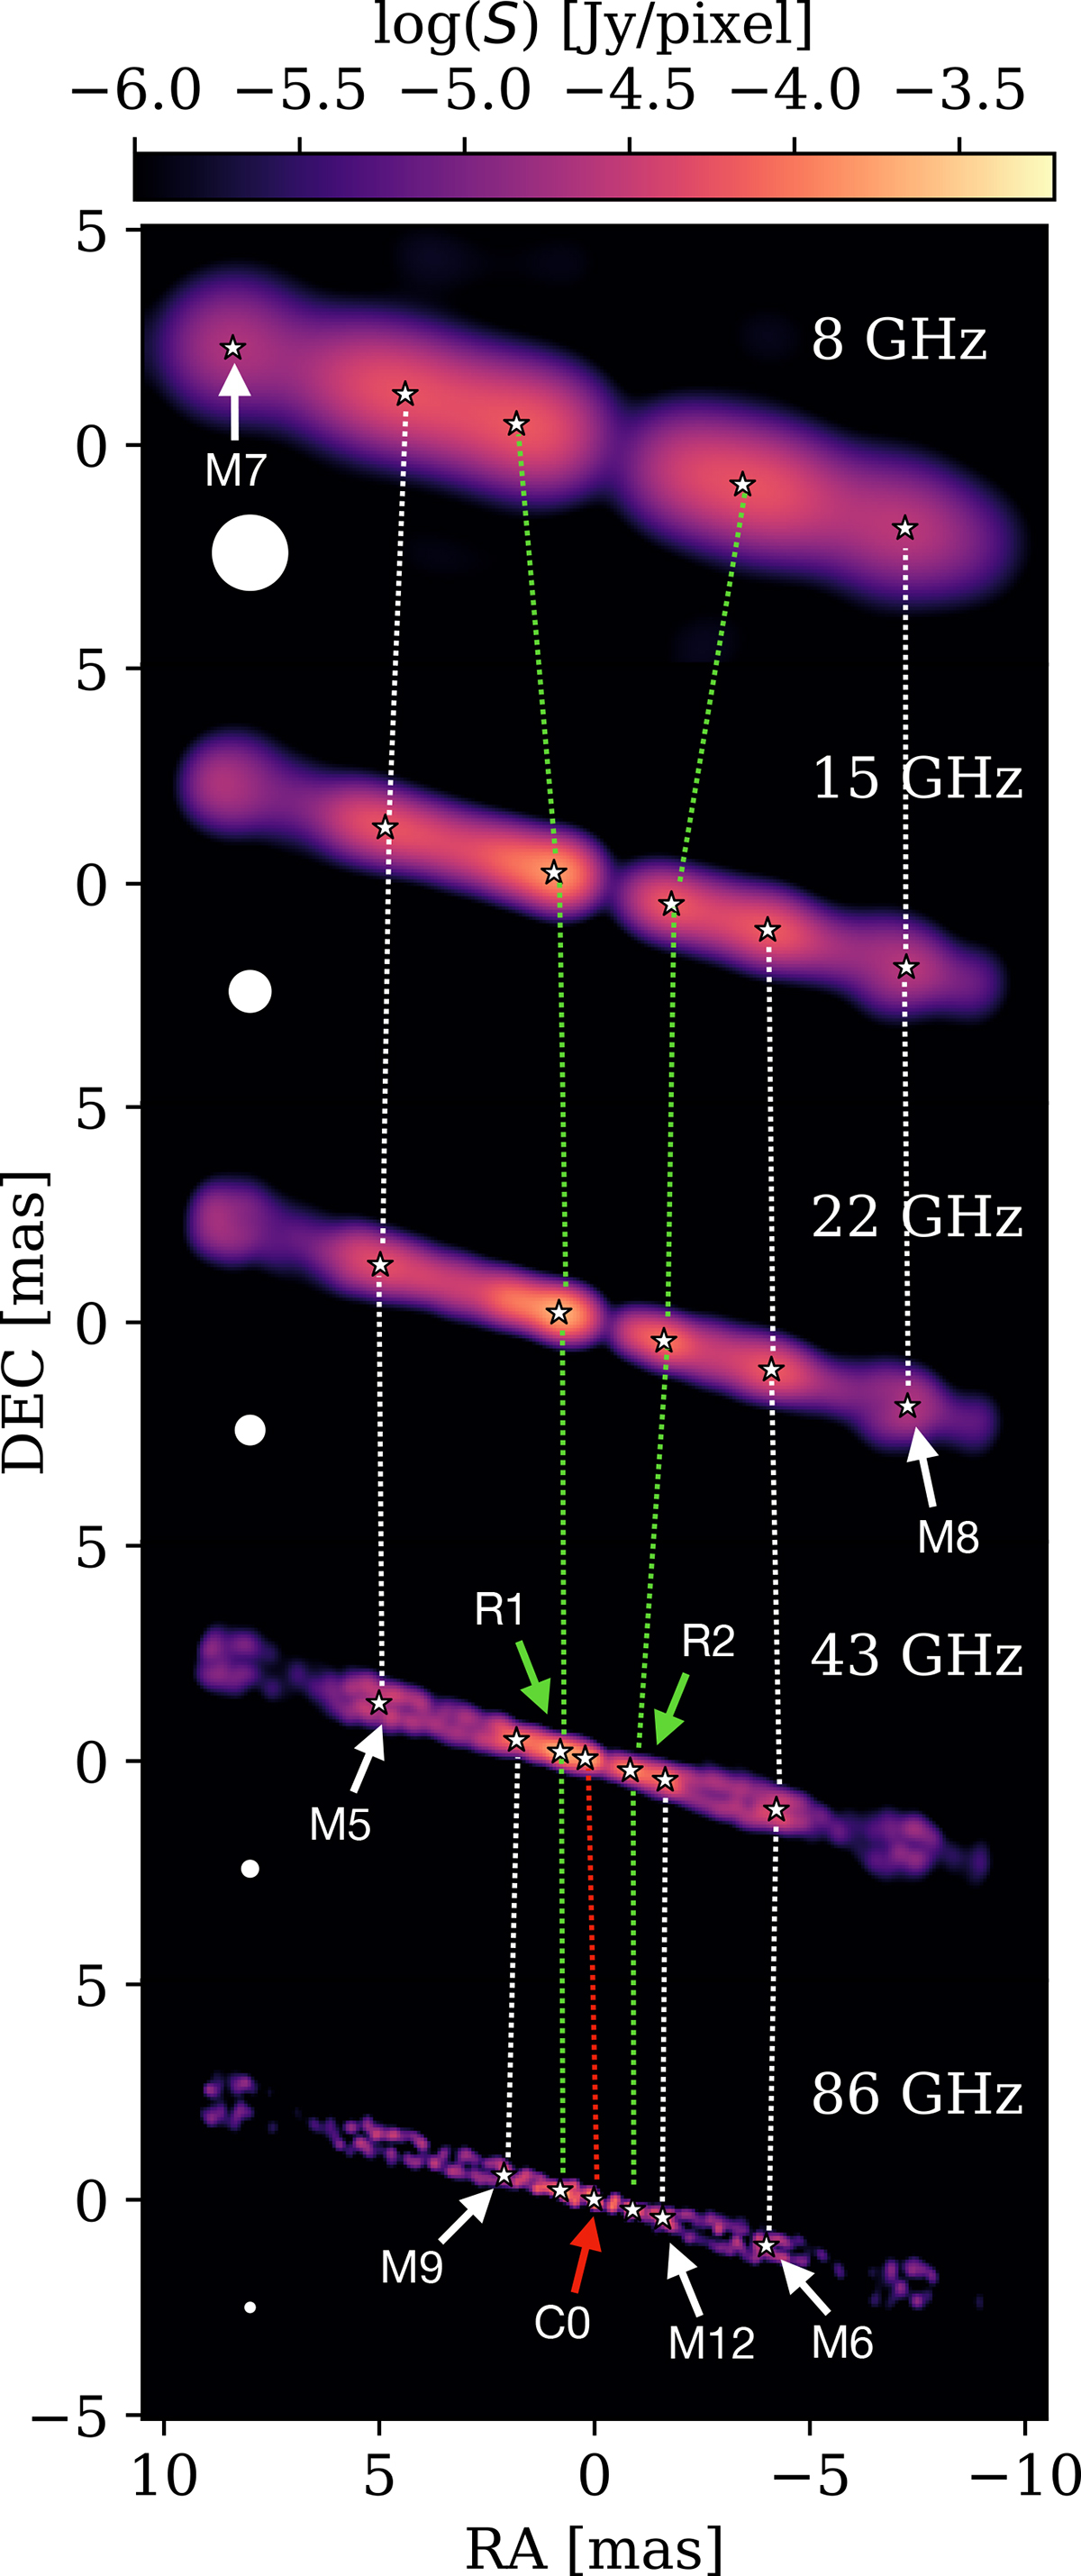
Reconstructed and circularly blurred maps at all five frequencies in the May 5, 2005, snapshot. The components detected by our algorithm have been marked. The identified trajectories are connected through the dotted lines: white for the moving shocks, green for the recollimation shocks, and red for the jet core.
Current usage metrics show cumulative count of Article Views (full-text article views including HTML views, PDF and ePub downloads, according to the available data) and Abstracts Views on Vision4Press platform.
Data correspond to usage on the plateform after 2015. The current usage metrics is available 48-96 hours after online publication and is updated daily on week days.
Initial download of the metrics may take a while.