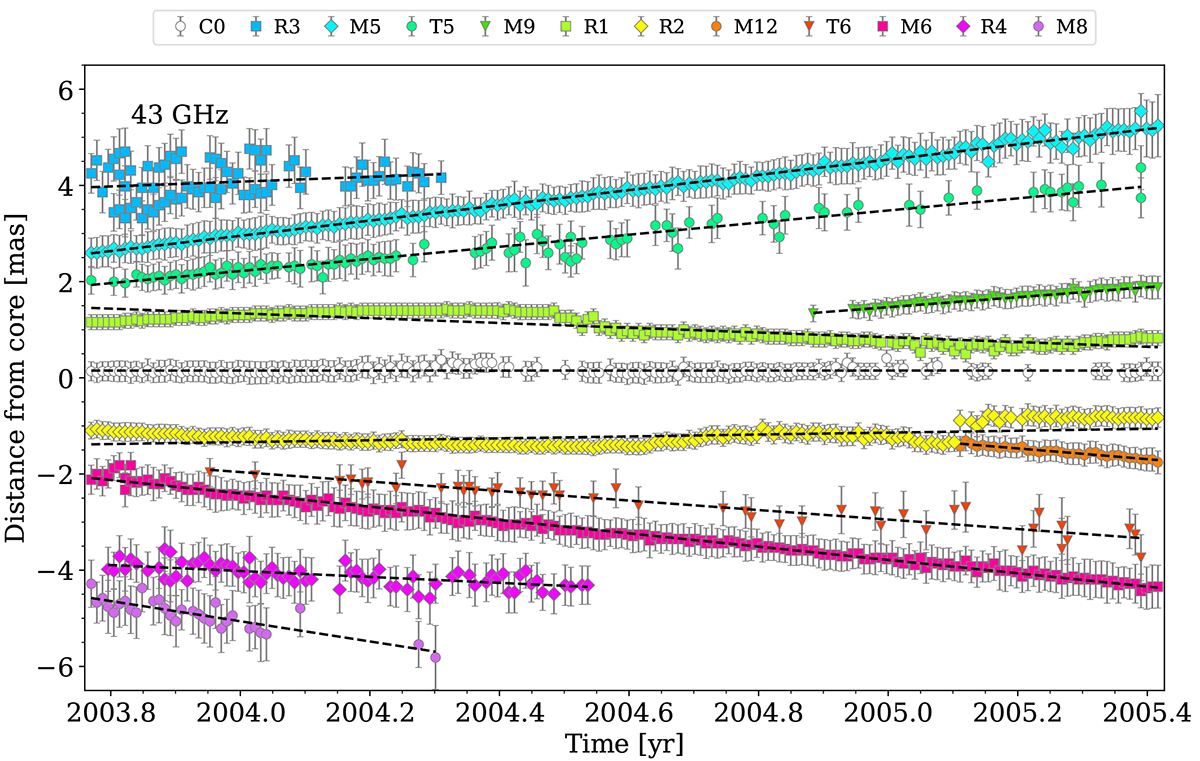
Fig. 10.
Download original image
Distance of bright components from the central core, identified here as C0, over time for the 43 GHz maps. The components located in the left or right jet are marked with an odd or even number, respectively. Recollimation shocks are indicated by the letter R, moving components by the letter M, and their trailing shocks by the letter T, followed by the same number of the component which they trail. The dashed lines on each component correspond to a linear fit.
Current usage metrics show cumulative count of Article Views (full-text article views including HTML views, PDF and ePub downloads, according to the available data) and Abstracts Views on Vision4Press platform.
Data correspond to usage on the plateform after 2015. The current usage metrics is available 48-96 hours after online publication and is updated daily on week days.
Initial download of the metrics may take a while.