Open Access
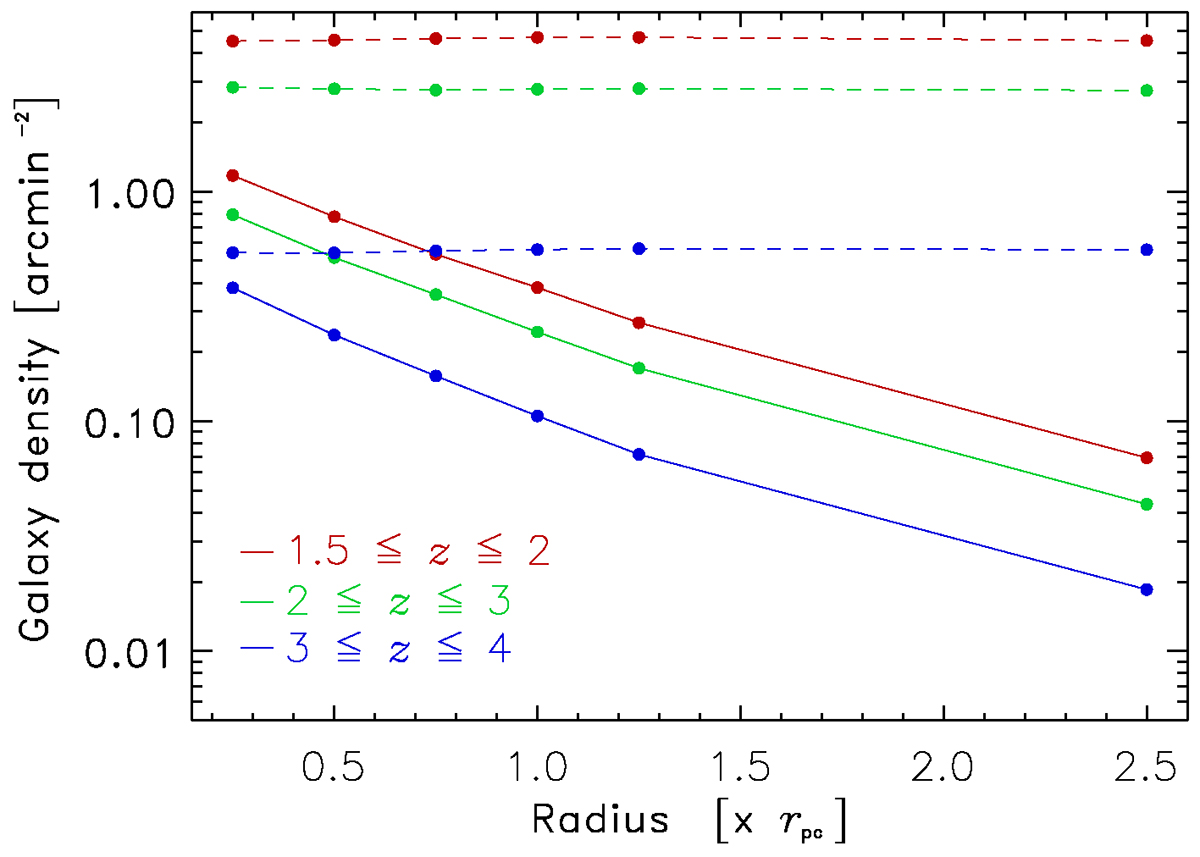
Fig. 9.
Download original image
Mean projected galaxy densities in proto-clusters (solid lines) as a function of aperture radius in three redshift intervals. The dashed curves give the galaxy densities in the background. The results were derived for Δz (50%).
Current usage metrics show cumulative count of Article Views (full-text article views including HTML views, PDF and ePub downloads, according to the available data) and Abstracts Views on Vision4Press platform.
Data correspond to usage on the plateform after 2015. The current usage metrics is available 48-96 hours after online publication and is updated daily on week days.
Initial download of the metrics may take a while.