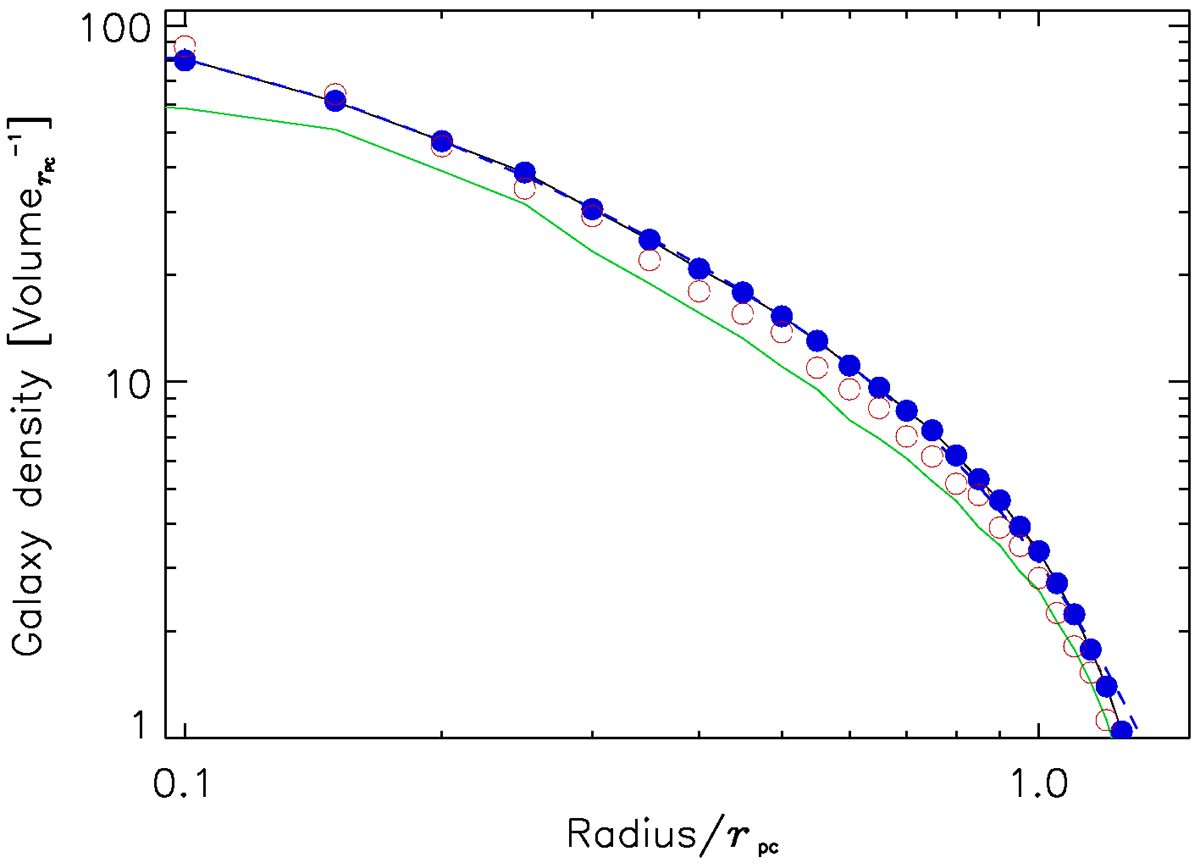
Fig. 5.
Download original image
Mean three-dimensional radial density profile of proto-clusters. The black solid line and blue points show the mean profile for all proto-clusters in the GAEA F lightcone in the redshift range z = 1.5 − 4, while the green curve shows that for proto-clusters with z = 1.5 − 2. The blue dashed curve shows the model fit. The red open symbols show the density profile for the clusters in the MAMBO lightcone (z = 1.5 − 4) for comparison. The galaxy density is scaled to the volume of the proto-cluster, volumerPC = (4/3)πrPC3.
Current usage metrics show cumulative count of Article Views (full-text article views including HTML views, PDF and ePub downloads, according to the available data) and Abstracts Views on Vision4Press platform.
Data correspond to usage on the plateform after 2015. The current usage metrics is available 48-96 hours after online publication and is updated daily on week days.
Initial download of the metrics may take a while.