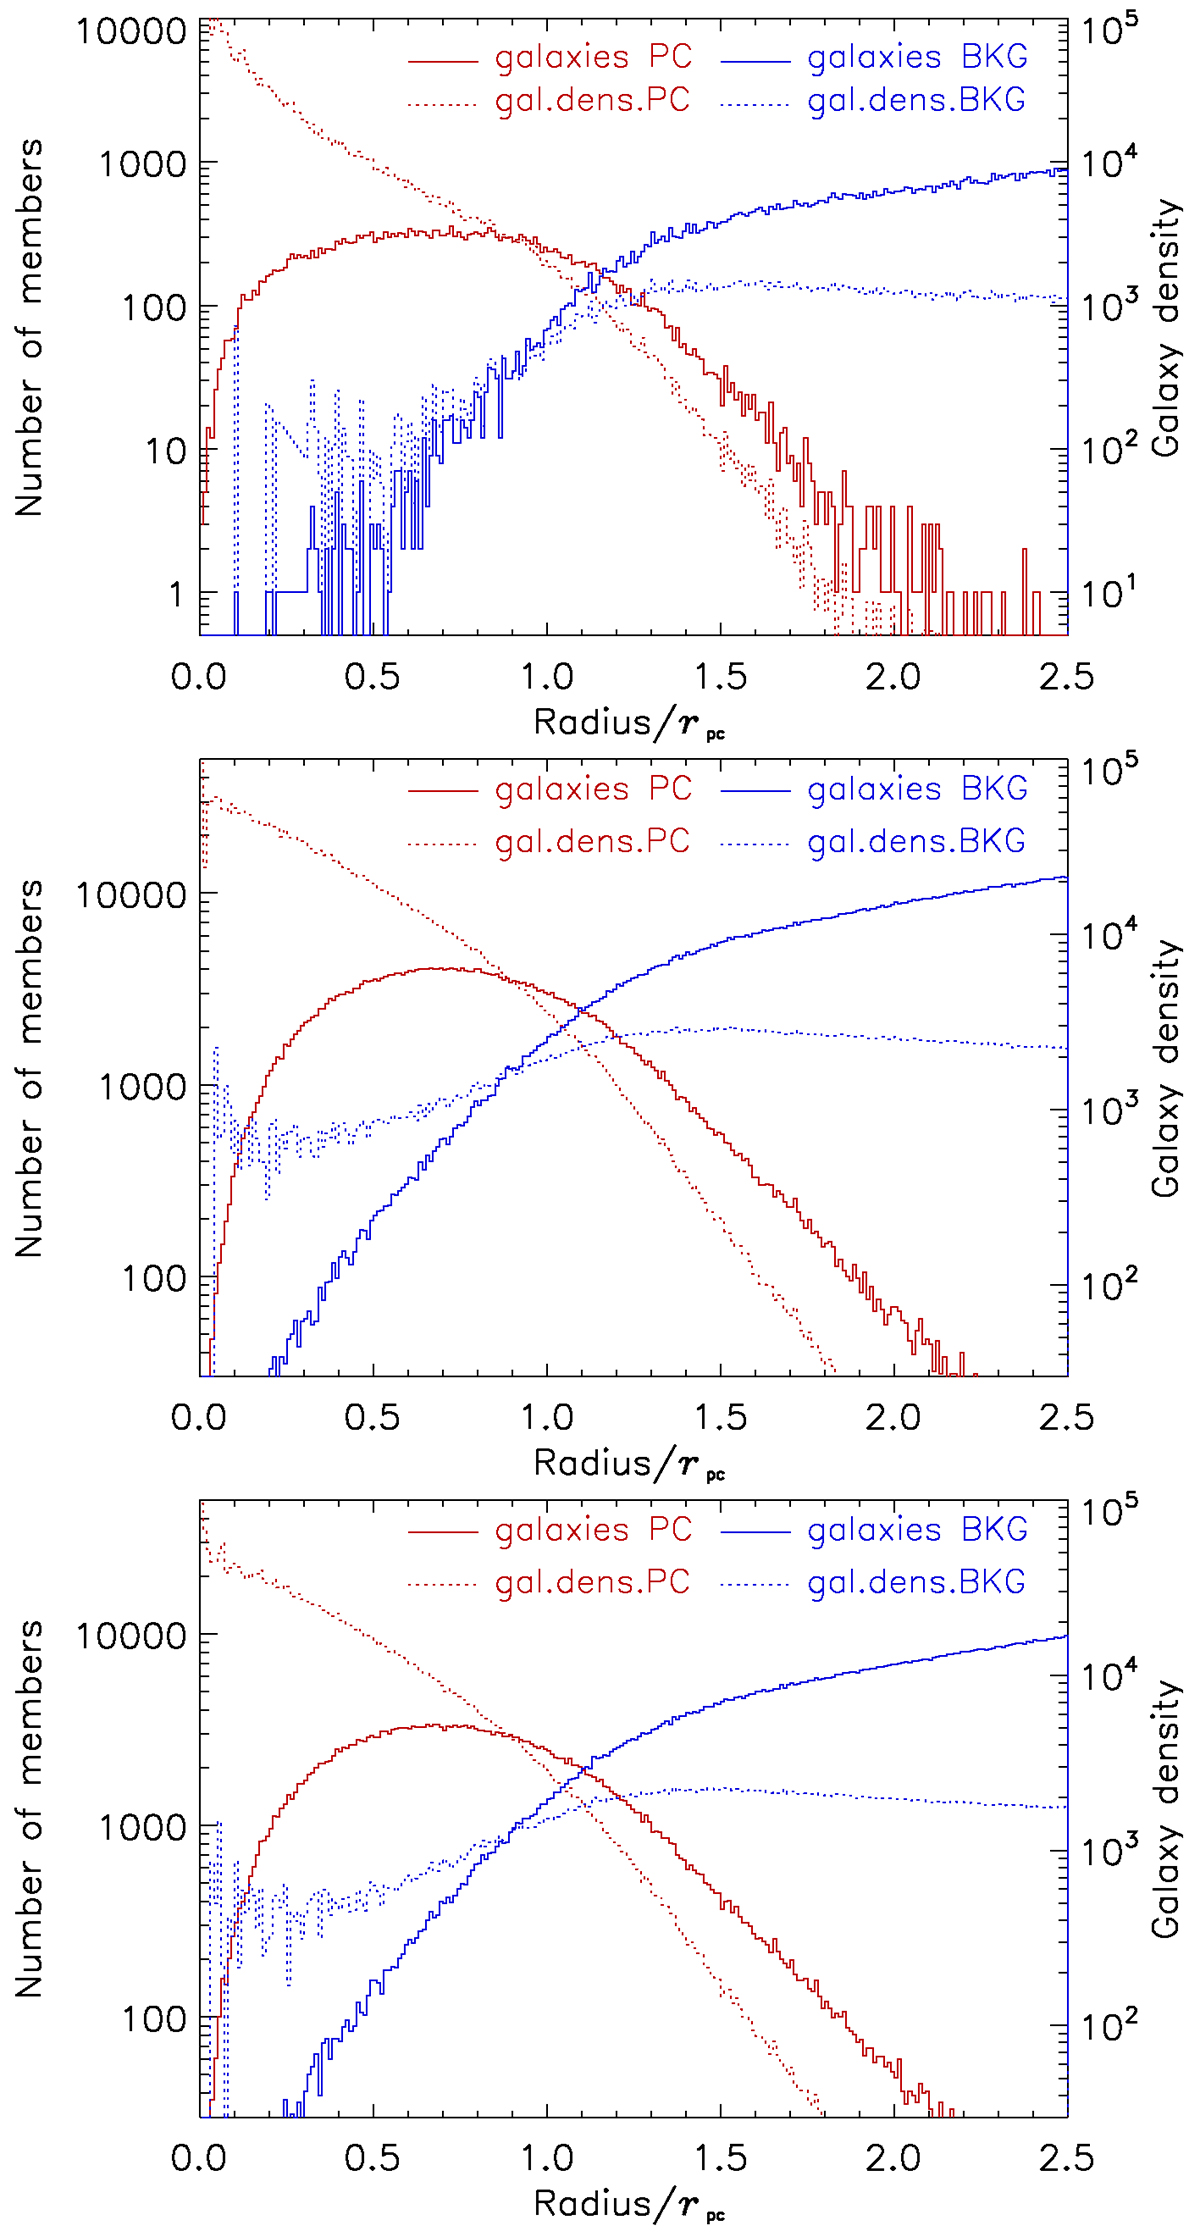
Fig. 4.
Download original image
Three-dimensional radial distribution of the member galaxies in all MAMBO (top), GAEA-H (middle), and GAEA-F (bottom) proto-clusters (z = 1.5 − 4). The radius is in units of the estimated proto-cluster radius, rpc. The red lines show the numbers and densities of the proto-cluster members, and the blue lines those of the non-member galaxies. The solid lines show the galaxy number in the shells (left Y-axis), while the dotted lines show the galaxy density in the shells (right Y-axis).
Current usage metrics show cumulative count of Article Views (full-text article views including HTML views, PDF and ePub downloads, according to the available data) and Abstracts Views on Vision4Press platform.
Data correspond to usage on the plateform after 2015. The current usage metrics is available 48-96 hours after online publication and is updated daily on week days.
Initial download of the metrics may take a while.