Open Access
Fig. A.1.
Download original image
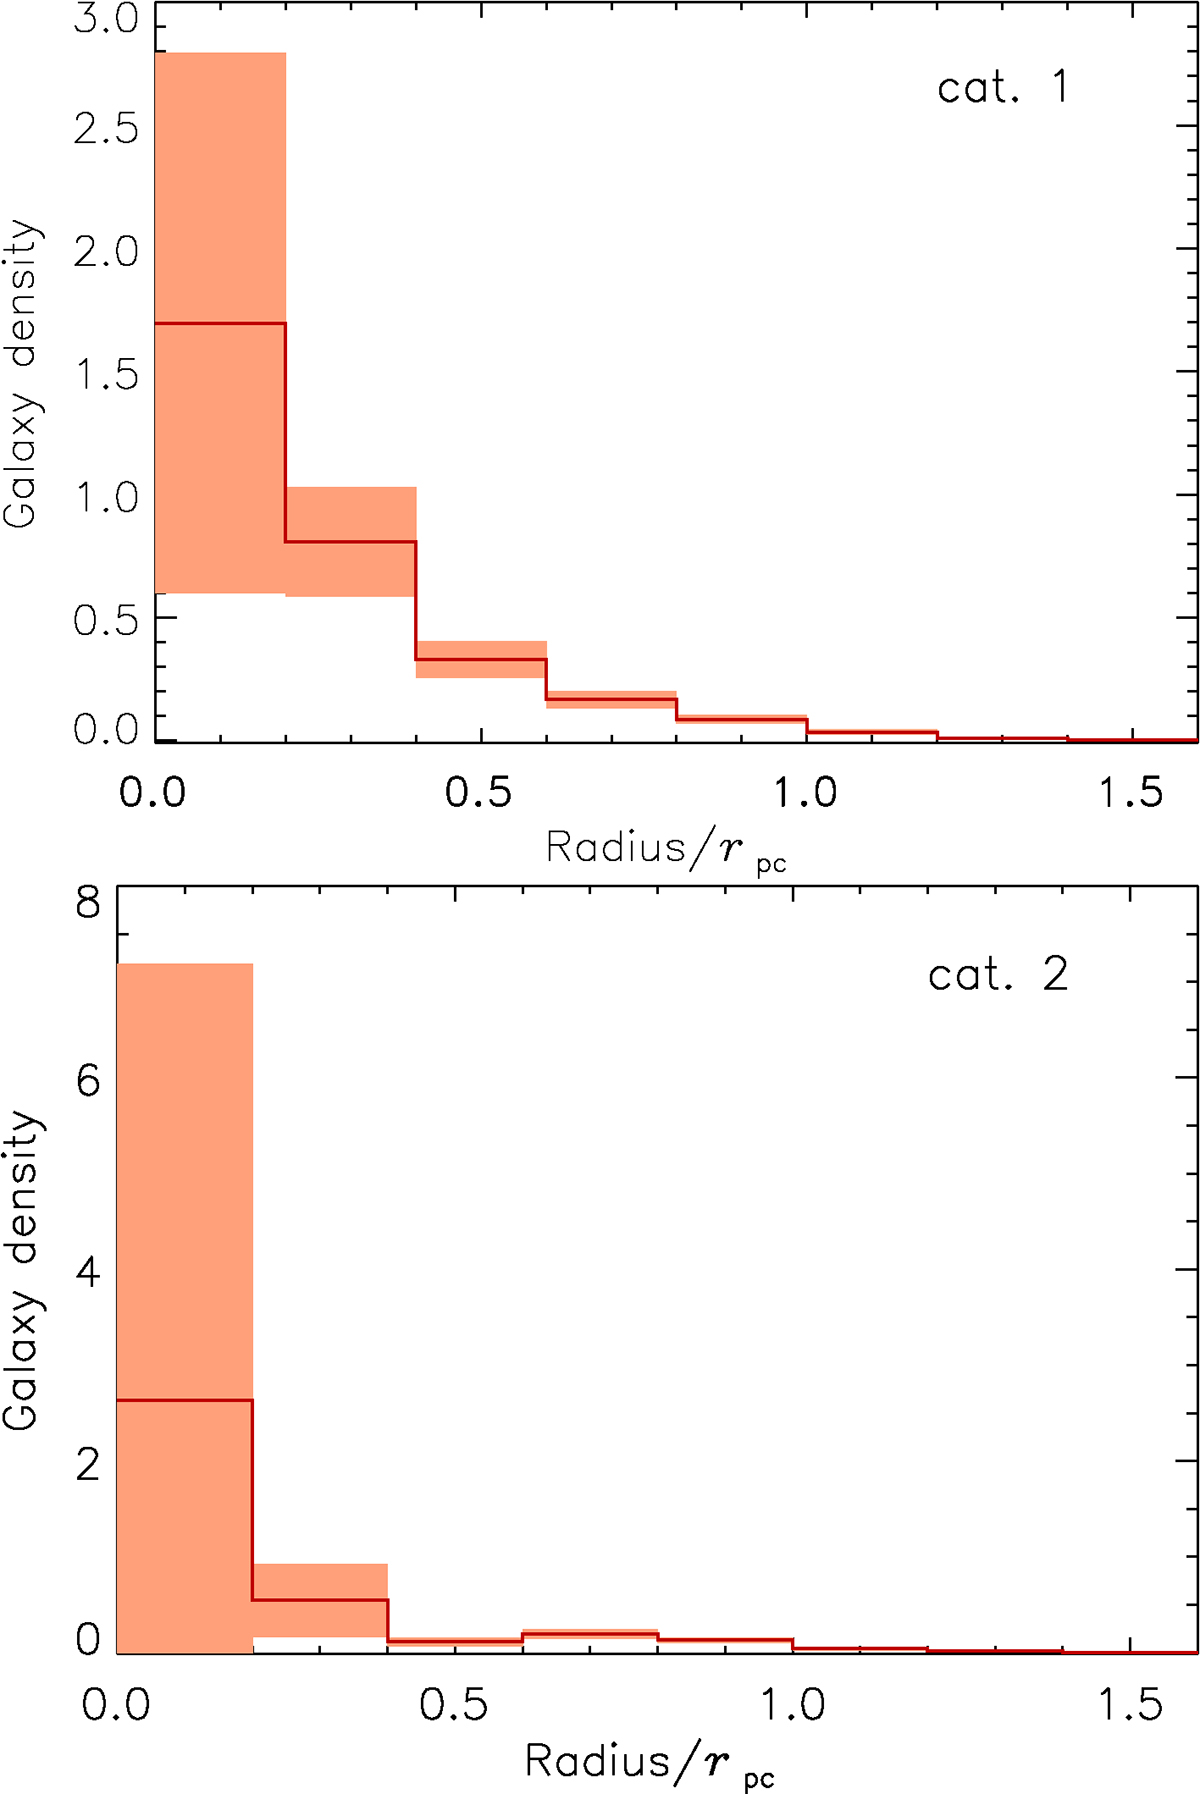
Mean profiles of the proto-clusters for two of the five structural categories defined in the text, where the categories are labelled in the panels. The shaded regions in the histograms indicate the rms variance of the density.
Current usage metrics show cumulative count of Article Views (full-text article views including HTML views, PDF and ePub downloads, according to the available data) and Abstracts Views on Vision4Press platform.
Data correspond to usage on the plateform after 2015. The current usage metrics is available 48-96 hours after online publication and is updated daily on week days.
Initial download of the metrics may take a while.