Fig. 21.
Download original image
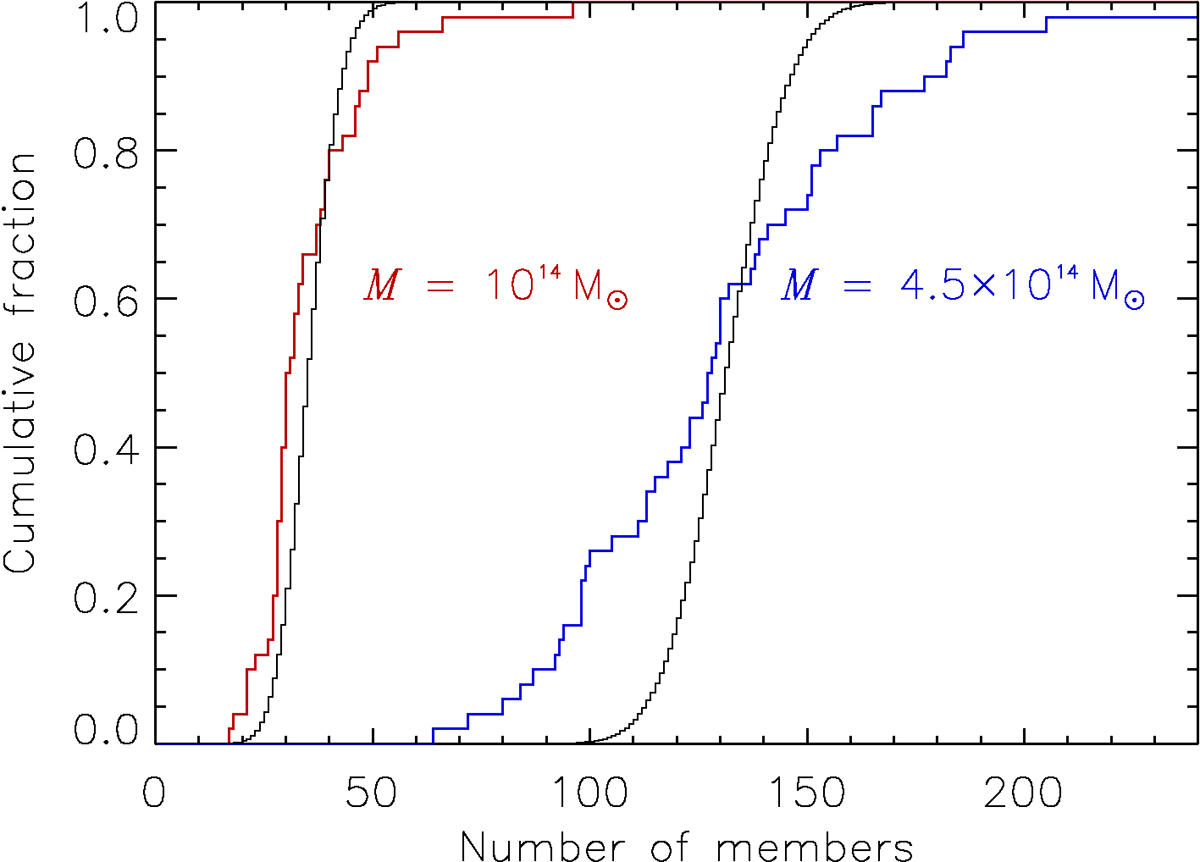
Comparison of the distribution of the galaxy membership counts (richness) for given mass and the prediction for Poissionian scatter (black curves). The mean masses in the interval are 1014 M⊙ (red curve) and 4.5 × 10¹⁴ M⊙ (blue curve), respectively. The curves show cumulative histograms normalised to unity. The data are taken from the GAEA F lightcone in the redshift interval z = 1.5 − 2.
Current usage metrics show cumulative count of Article Views (full-text article views including HTML views, PDF and ePub downloads, according to the available data) and Abstracts Views on Vision4Press platform.
Data correspond to usage on the plateform after 2015. The current usage metrics is available 48-96 hours after online publication and is updated daily on week days.
Initial download of the metrics may take a while.