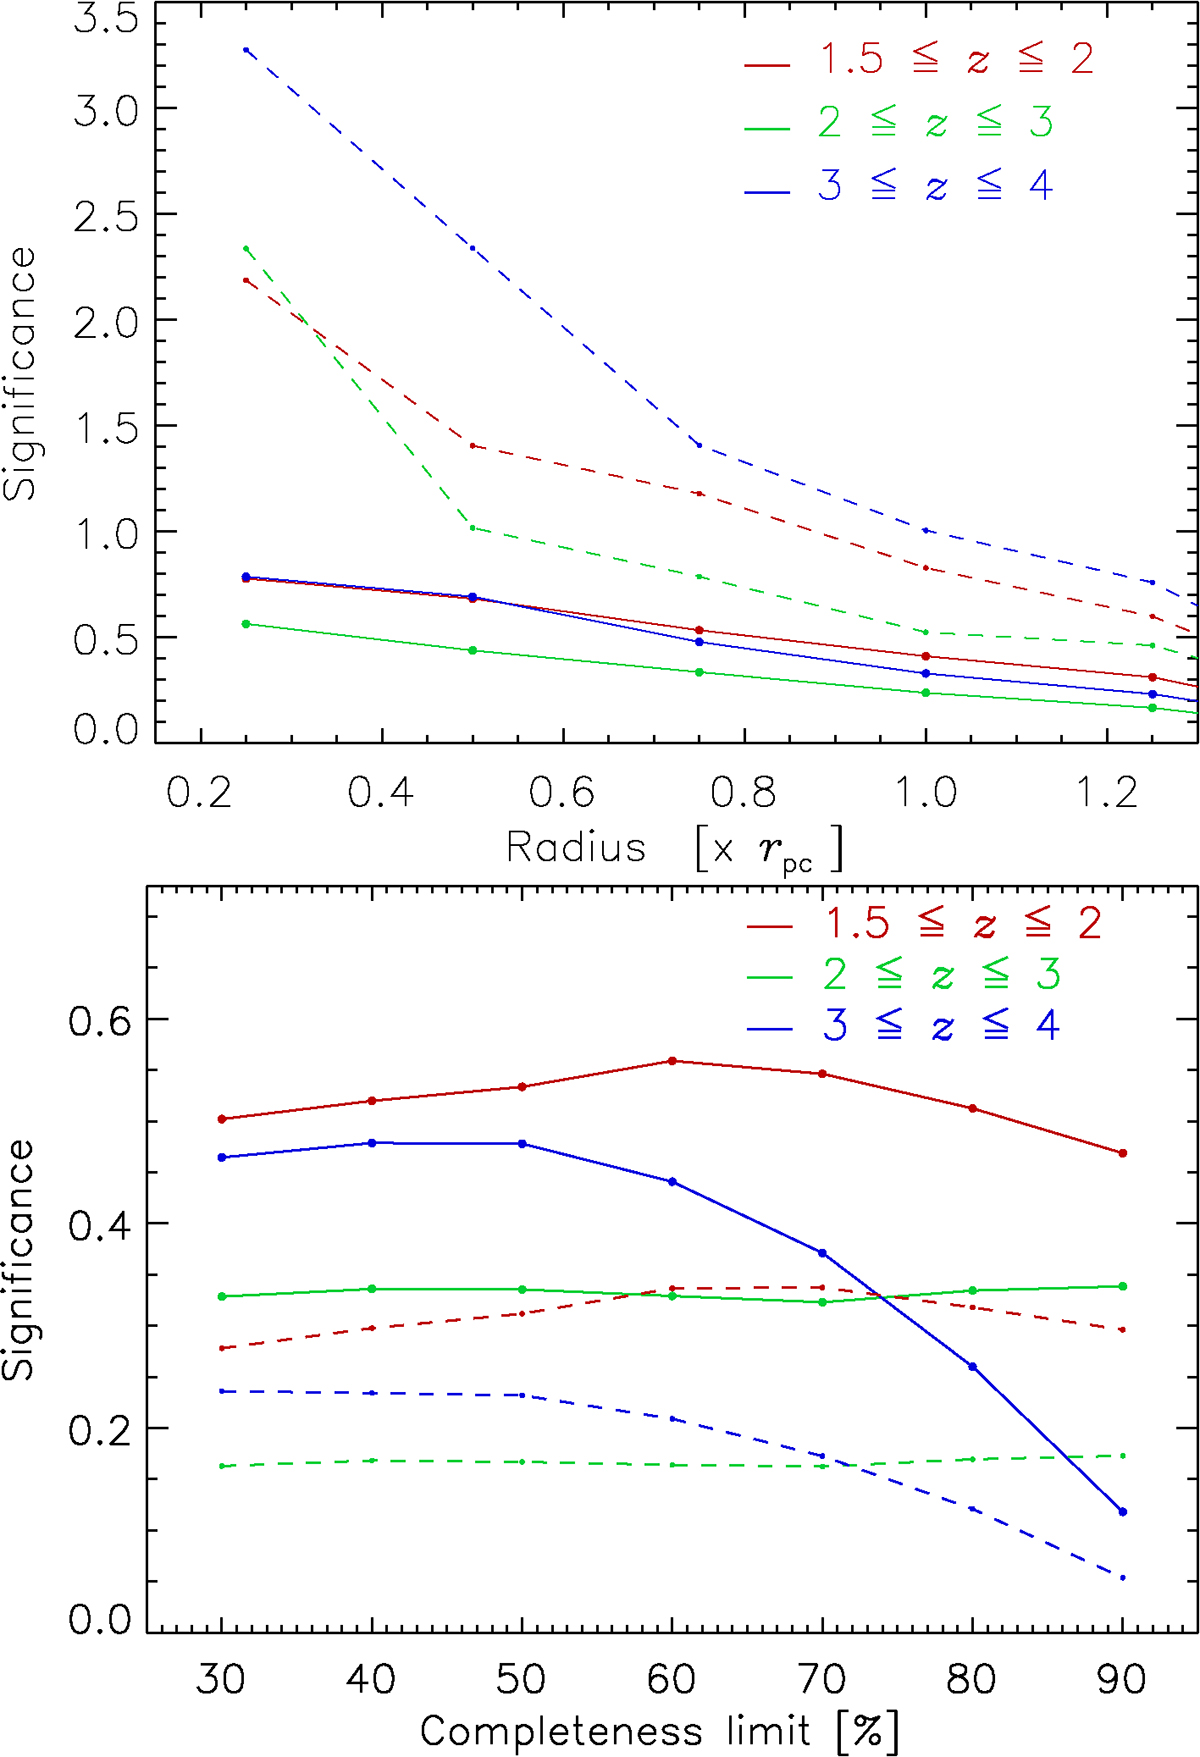
Fig. 13.
Download original image
Detection significance of proto-clusters as a function of aperture radius (top) and as a function of completeness limit (bottom) for three different redshift intervals. Top: The solid curves show the mean significance, while the dashed curves show the maxima. A redshift interval of Δz (50%) was used. Bottom: The completeness limit, Δz (X%), covers the range 30–90%. The solid lines show the results for an aperture radius of 0.5 rpc and dashed lines for 1 rpc.
Current usage metrics show cumulative count of Article Views (full-text article views including HTML views, PDF and ePub downloads, according to the available data) and Abstracts Views on Vision4Press platform.
Data correspond to usage on the plateform after 2015. The current usage metrics is available 48-96 hours after online publication and is updated daily on week days.
Initial download of the metrics may take a while.