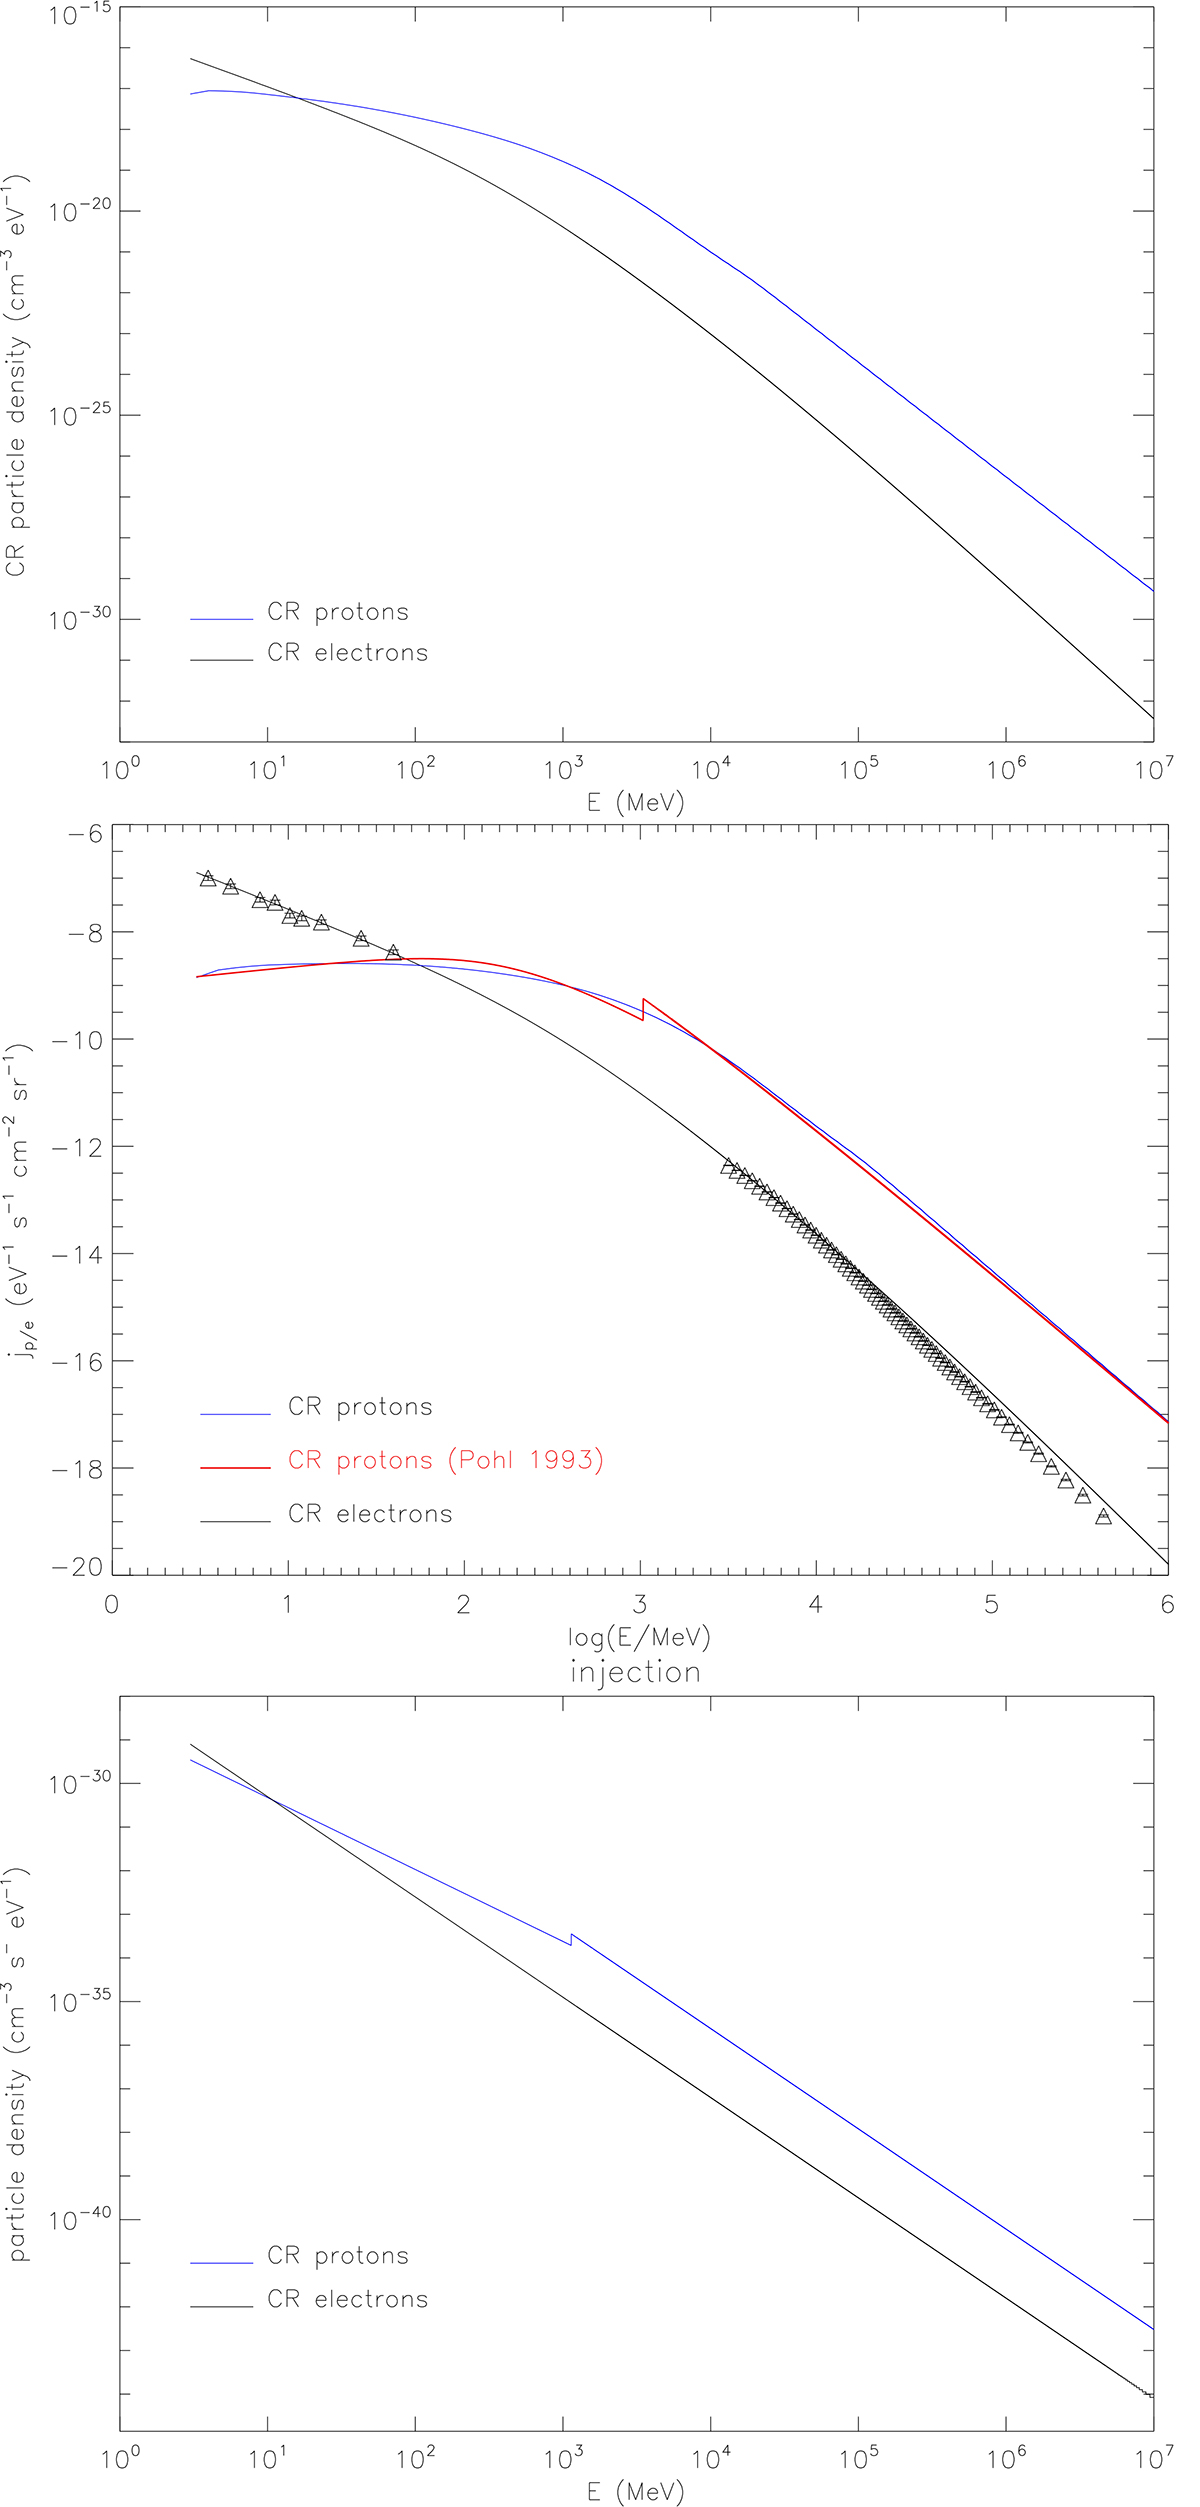
Fig. 3.
Download original image
Cosmic rays in the solar neighborhood. Upper panel: Model CR particle density spectra. Middle panel: CR energy spectra. The solid black line shows the CR electron model (Pohl 1993), the solid red line shows the CR proton model (Pohl 1993), the solid blue line shows the GALPROP model fit to observations by Cummings et al. (2016), and triangles shows Voyager 1 data (Cummings et al. 2016) and AMS data (Aguilar et al. 2019). Lower panel: CR injection spectra.
Current usage metrics show cumulative count of Article Views (full-text article views including HTML views, PDF and ePub downloads, according to the available data) and Abstracts Views on Vision4Press platform.
Data correspond to usage on the plateform after 2015. The current usage metrics is available 48-96 hours after online publication and is updated daily on week days.
Initial download of the metrics may take a while.