Fig. 22.
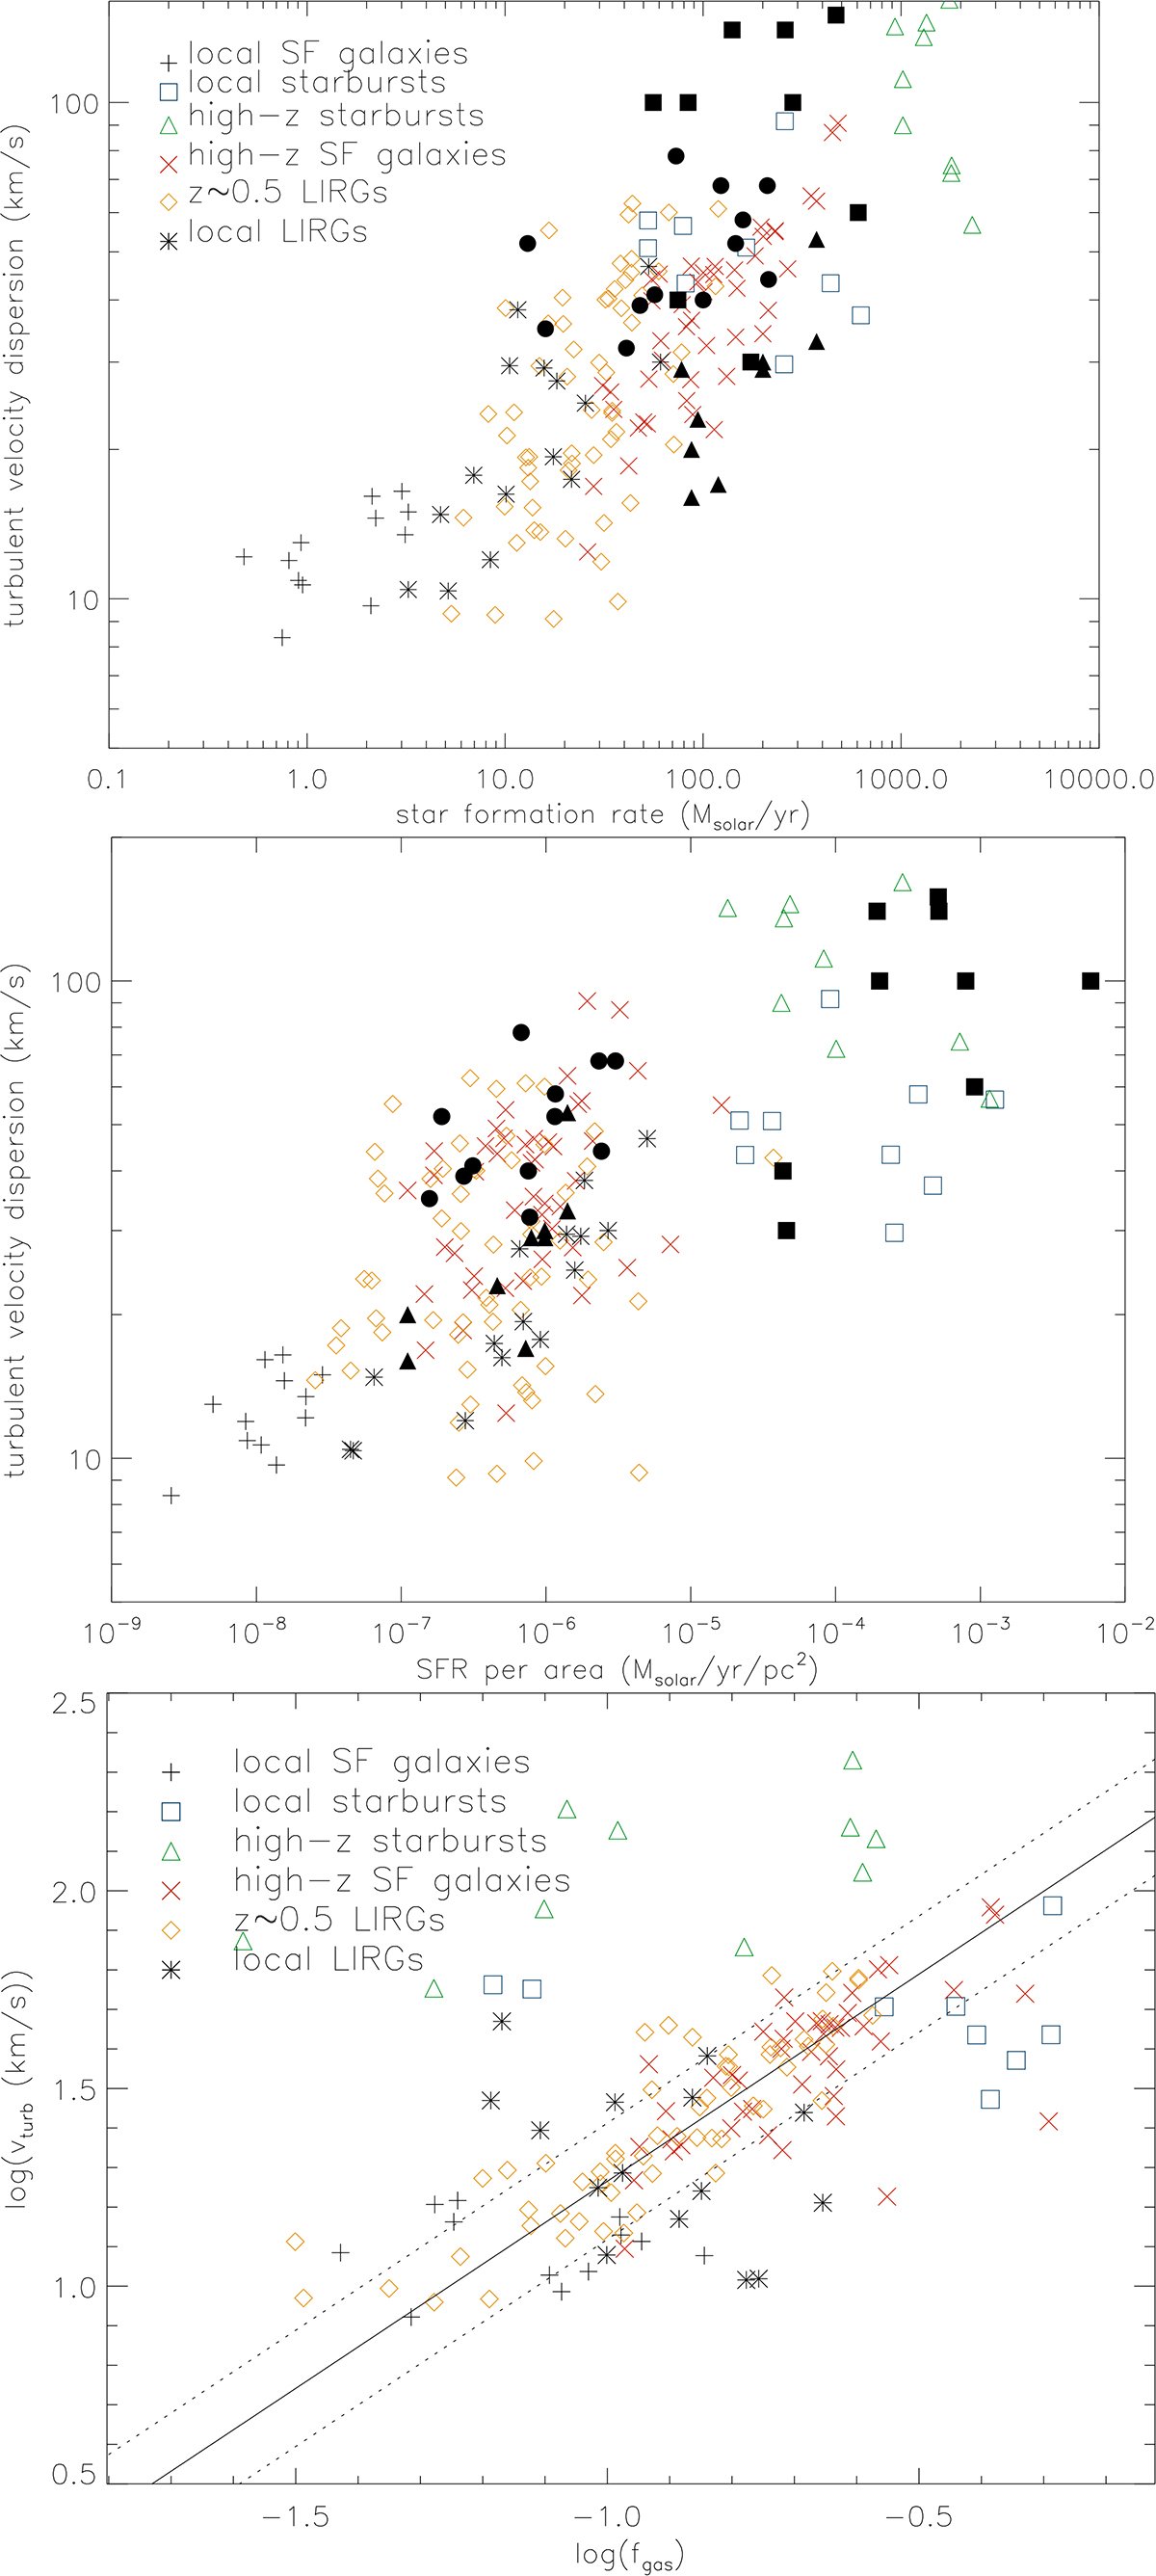
Download original image
Model turbulent velocity as a function of the SFR (upper panel), the SFR per unit area (middle panel), and the gas fraction (lower panel). The filled circles and boxes correspond to observed values (Downes & Solomon 1998; Cresci et al. 2009; Tacconi et al. 2013; Girard et al. 2021; Nestor Shachar et al. 2023). The lines correspond to an outlier-resistant linear bisector fit and its dispersion.
Current usage metrics show cumulative count of Article Views (full-text article views including HTML views, PDF and ePub downloads, according to the available data) and Abstracts Views on Vision4Press platform.
Data correspond to usage on the plateform after 2015. The current usage metrics is available 48-96 hours after online publication and is updated daily on week days.
Initial download of the metrics may take a while.