Open Access
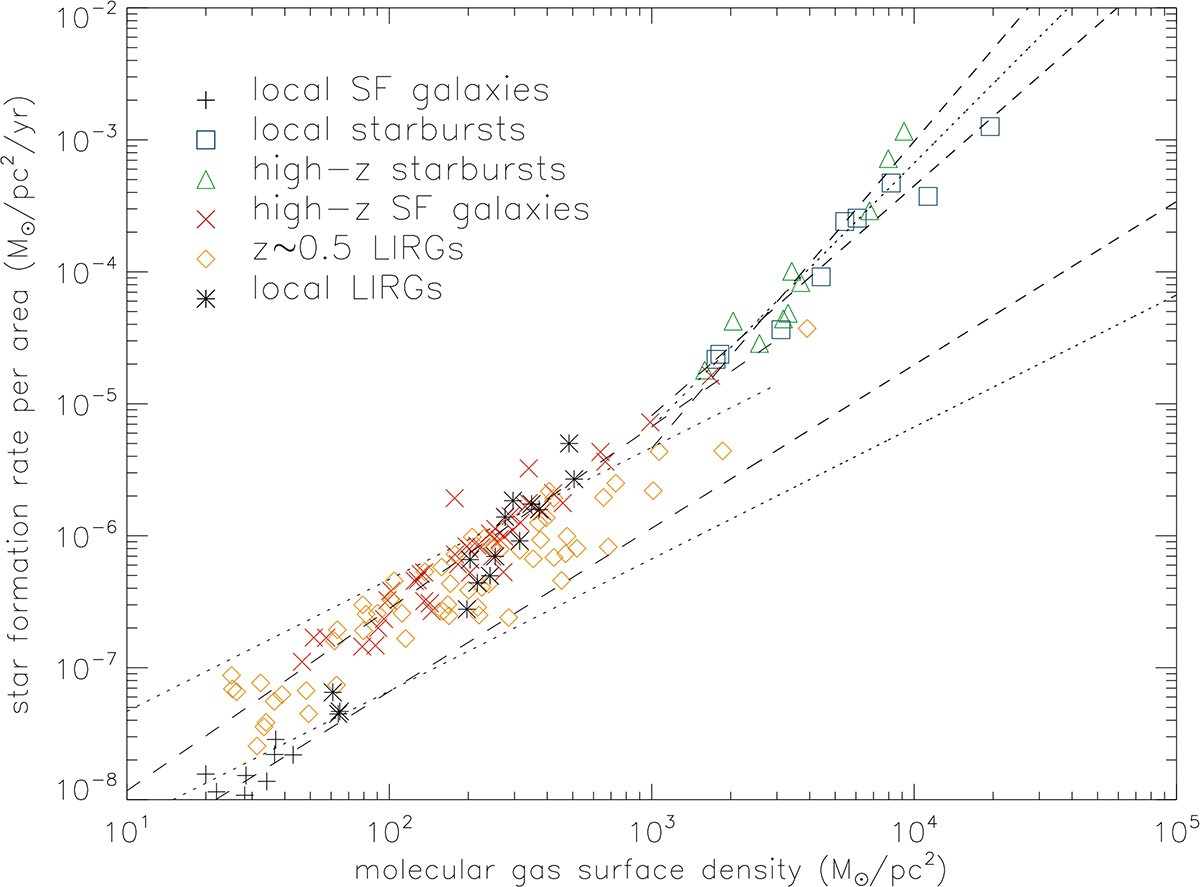
Fig. 19.
Download original image
Star formation rate per unit area as a function of the molecular gas surface density. The dotted lines show linear and square fits to guide the eye. The dashed lines show robust fits to the different galaxy samples.
Current usage metrics show cumulative count of Article Views (full-text article views including HTML views, PDF and ePub downloads, according to the available data) and Abstracts Views on Vision4Press platform.
Data correspond to usage on the plateform after 2015. The current usage metrics is available 48-96 hours after online publication and is updated daily on week days.
Initial download of the metrics may take a while.