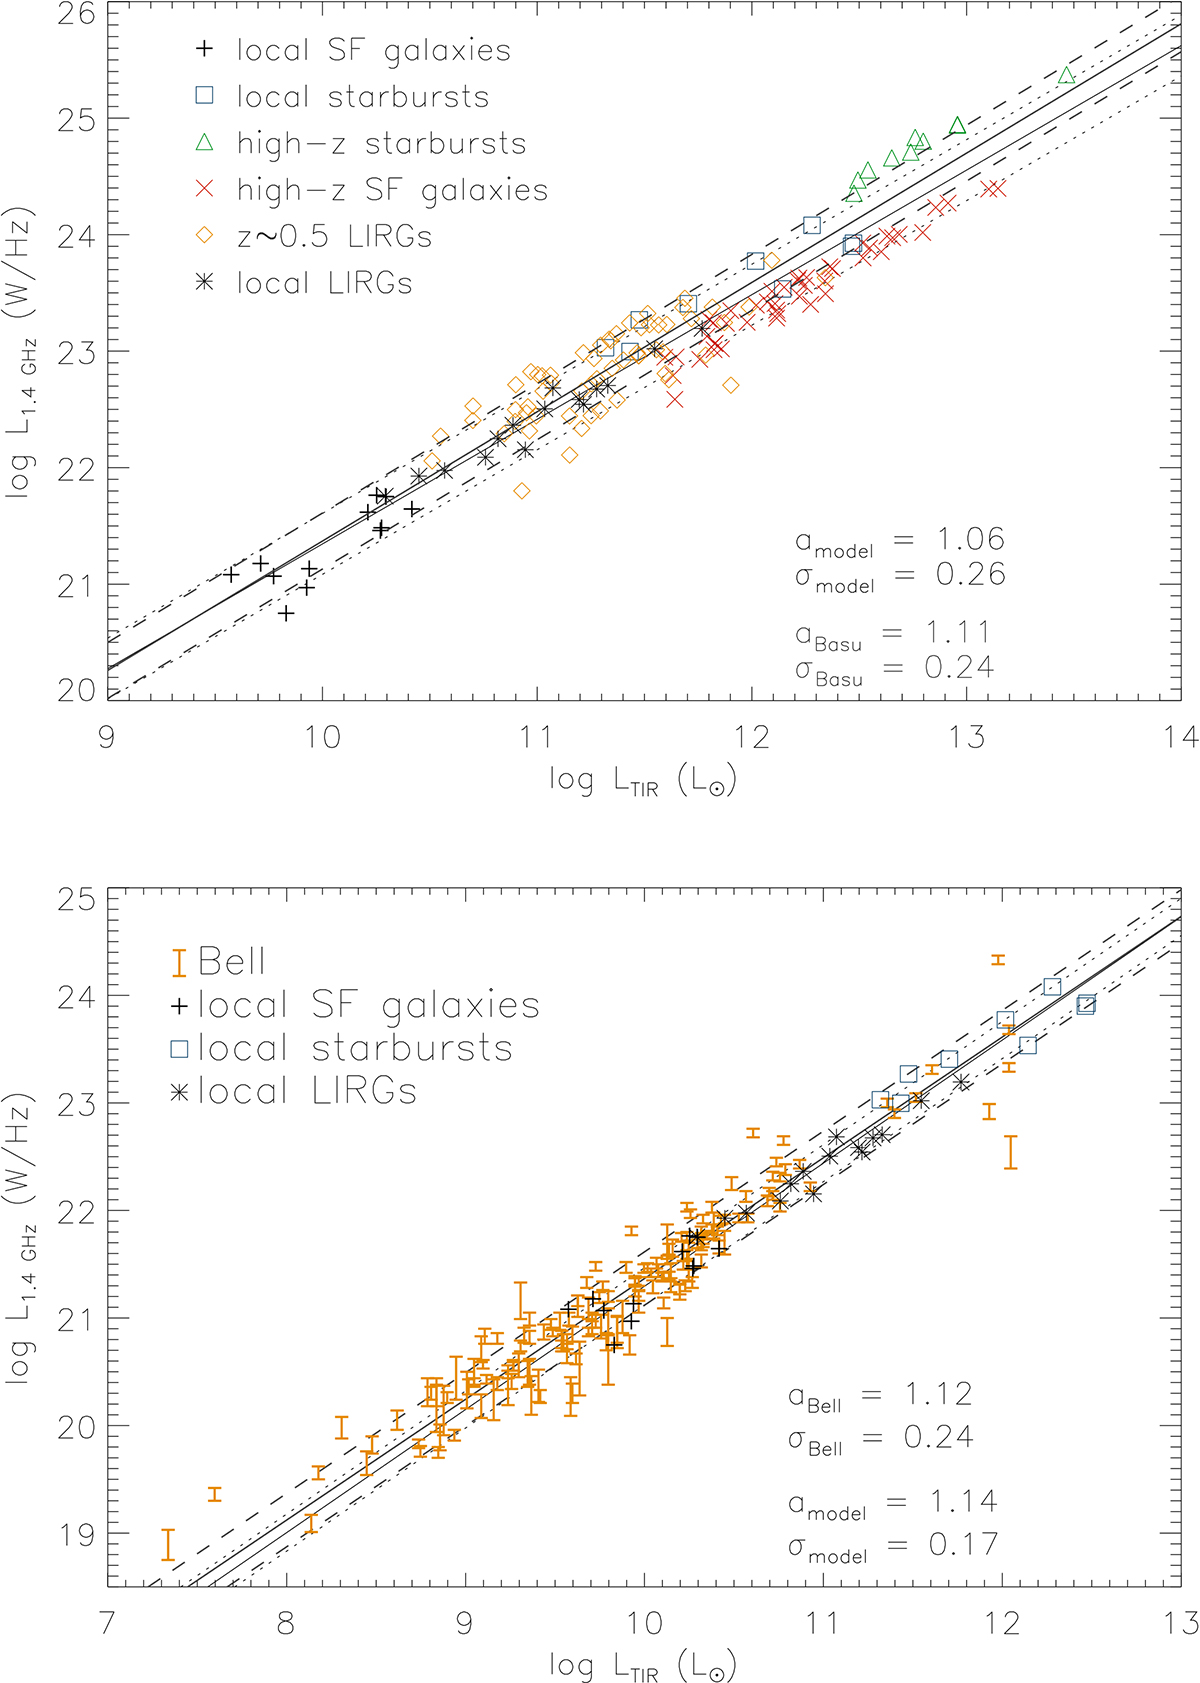
Fig. 16.
Download original image
TIR–1.4 GHz correlations. The symbols show the model galaxies. Black solid and dotted lines show the model linear regression. Upper panel: Gray solid and dashed lines show the observed linear regression (Beck 2015). Lower panel: Orange error bars show data from Bell (2003). Gray solid and dashed lines mark the observed linear regression (Bell 2003).
Current usage metrics show cumulative count of Article Views (full-text article views including HTML views, PDF and ePub downloads, according to the available data) and Abstracts Views on Vision4Press platform.
Data correspond to usage on the plateform after 2015. The current usage metrics is available 48-96 hours after online publication and is updated daily on week days.
Initial download of the metrics may take a while.