Fig. 15.
Download original image
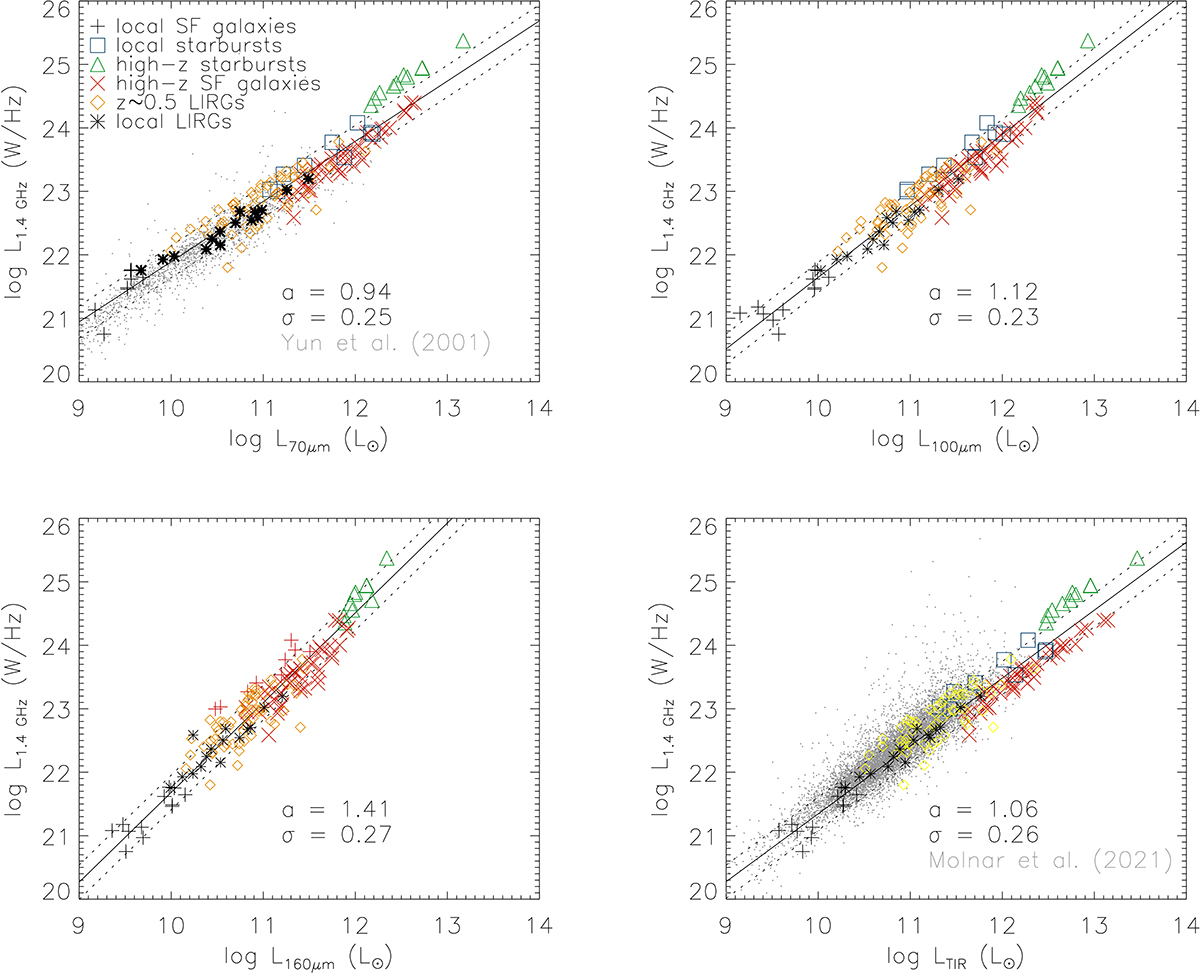
IR-radio correlations. Upper left: 70 μm – 1.4 GHz correlation. Upper right: 100 μm – 1.4 GHz correlation. Lower left: 160 μm – 1.4 GHz correlation. Lower right: TIR – 1.4 GHz correlation. The colored and black symbols show model galaxies. For clarity, the z ∼ 0.5 LIRGs are shown as yellow diamonds in the lower right panel. The solid and dotted black lines mark the model linear regression. The gray dots show the observations.
Current usage metrics show cumulative count of Article Views (full-text article views including HTML views, PDF and ePub downloads, according to the available data) and Abstracts Views on Vision4Press platform.
Data correspond to usage on the plateform after 2015. The current usage metrics is available 48-96 hours after online publication and is updated daily on week days.
Initial download of the metrics may take a while.