Open Access
Fig. 11.
Download original image
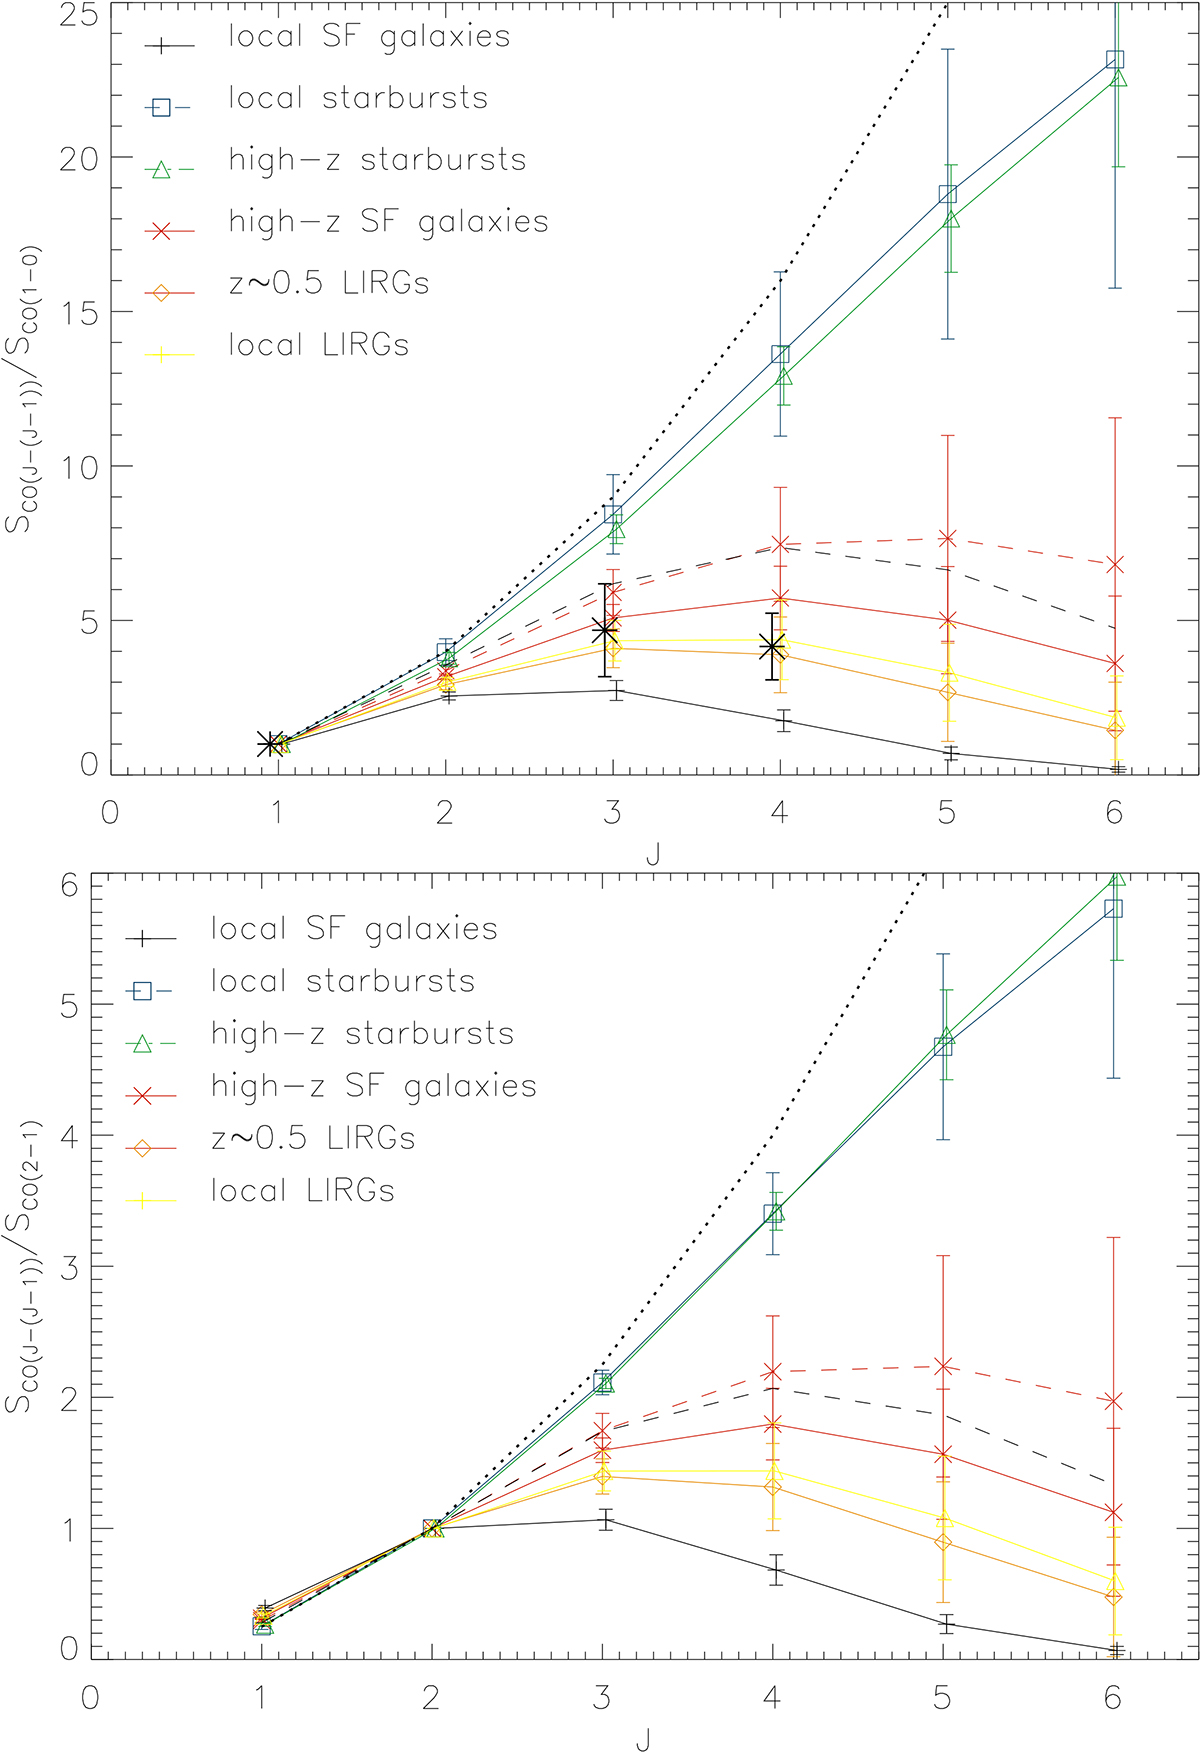
Mean model CO SLEDs of our galaxy samples. The dotted line corresponds to a constant brightness temperature. The high-z SF galaxy sample was divided into a z ∼ 1.5 (solid red) and a z > 2 (dashed red) subsample. IRAS 08339+6517 is shown by the dashed black line.
Current usage metrics show cumulative count of Article Views (full-text article views including HTML views, PDF and ePub downloads, according to the available data) and Abstracts Views on Vision4Press platform.
Data correspond to usage on the plateform after 2015. The current usage metrics is available 48-96 hours after online publication and is updated daily on week days.
Initial download of the metrics may take a while.